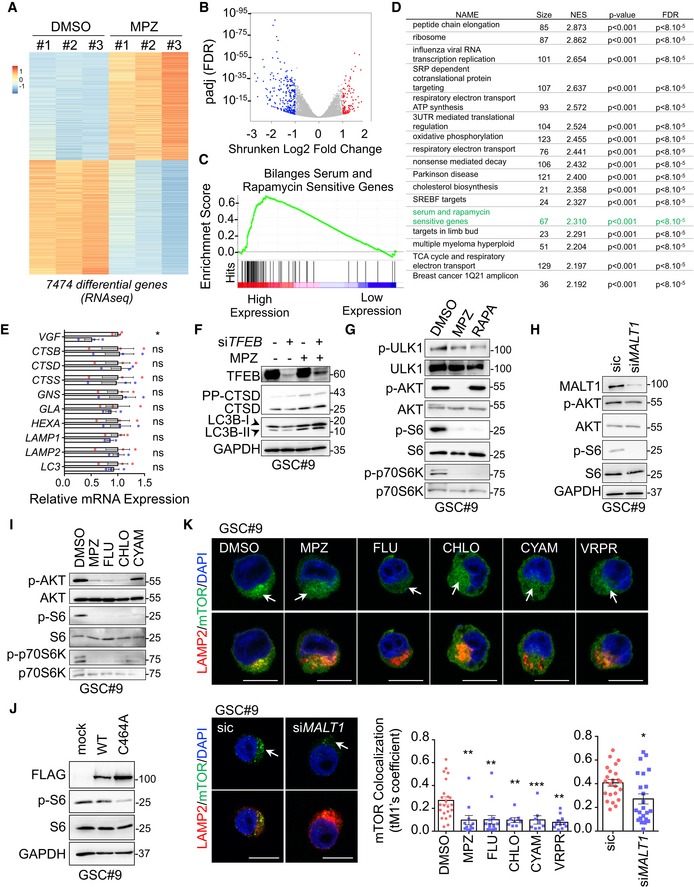
Heatmap of differentially expressed genes obtained from RNAseq analysis of GSC#9 treated for 4 h with vehicle (DMSO) or MPZ (20 μM), from three biological replicates.
Volcano plot of differentially expressed genes in RNAseq analysis of GSC#9, expressed as fold changes between vehicle (DMSO) and MPZ‐treated cells.
GSEA (gene set enrichment analysis) plot showing enrichment of “Bilanges serum and rapamycin sensitive genes” signature in vehicle (DMSO) versus MPZ‐treated triplicates.
Table of top differential pathways in DMSO versus MPZ‐treated triplicates. Size of each pathway, normalized enrichment scores (NES), P‐value, and false discovery rate q value (FDR) were indicated.
qRT–PCR was performed on total RNA from GSC#9 treated for 4 h with vehicle (DMSO) or MPZ (20 μM). Histograms showed changes in RNA expression of indicated targets. Data were normalized to two housekeeping genes (ACTB, HPRT1) and are presented as the mean ± SEM of technical triplicates.
Western blot analysis of LC3B, CTSD, and TFEB in total protein lysates from GSC#9 transfected with non‐silencing duplexes (sic) or siRNA duplexes targeting TFEB (siTFEB) and treated with vehicle (DMSO) or MPZ (20 μM) for 16 h. GAPDH served as a loading control.
Western blot analysis of p‐ULK1, p‐AKT, p‐S6, and p‐p70S6K in GSC#9 treated for 1 h with MPZ (20 μM) or rapamycin (RAPA, 50 nM). Total ULK, AKT, S6, and p70S6K served as loading controls. DMSO was used as a vehicle.
Western blot analysis of MALT1, p‐AKT, and p‐S6 in total protein lysates from GSC#9 transfected with non‐silencing duplexes (sic) or MALT1 targeting siRNA duplexes (siMALT1). Total AKT and S6, as well as GAPDH served as loading controls.
Western blot analysis of p‐AKT, p‐S6, and p‐p70S6K in total protein lysates from GSC#9 treated for 1 h with vehicle (DMSO) or 20 μM of phenothiazine compounds (MPZ, FLU, CHLO, and CYAM). Total AKT, total S6, and total p70S6K served as loading controls.
Western blot analysis of p‐S6 and FLAG in GSC#9 expressing WT or C464A MALT‐FLAG. Total S6 and GAPDH served as loading controls.
Confocal analysis of LAMP2 (red) and mTOR (green) staining in GSC#9 treated with vehicle (DMSO) or MPZ (20 μM), Z‐VRPR‐FMK (75 μM), FLU (20 μM), CHLO (20 μM), and CYAM (20 μM). Alternatively, cells were transfected with sic or siMALT1. Nuclei (DAPI) are shown in blue. Arrows point to LAMP2‐positive area. Scale bars: 10 μm. Quantification of mTOR colocalization score with LAMP2 is shown. The Coloc2 plug‐in from ImageJ was used to measure Mander's tM1 correlation factor in LAMP2‐positive ROI, using Costes threshold regression. Data are presented as the mean ± SEM on three independent experiments. Each dot represents one cell. n > 10.
= 3, unless specified. Statistics were performed using a two‐tailed
‐values stated. *
< 0.001.

