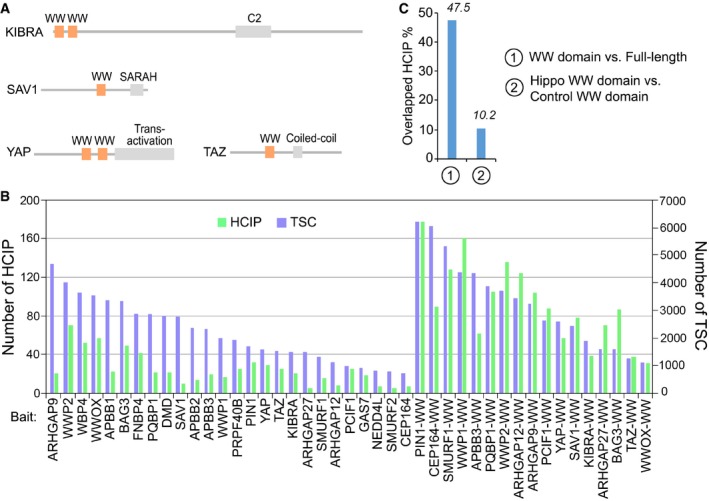
Figure EV1. Proteomic analysis of the WW‐containing proteins. (This figure is related to Fig 1).

- Schematic illustration of the Hippo WW domain‐containing components.
- The total spectral counts (TSCs) and corresponding numbers of HCIPs for the indicated proteomic experiments were listed.
- The overlapped HCIP rate was compared for the full‐length protein vs. its WW domain, and Hippo WW domains vs. control WW domains, respectively.
