
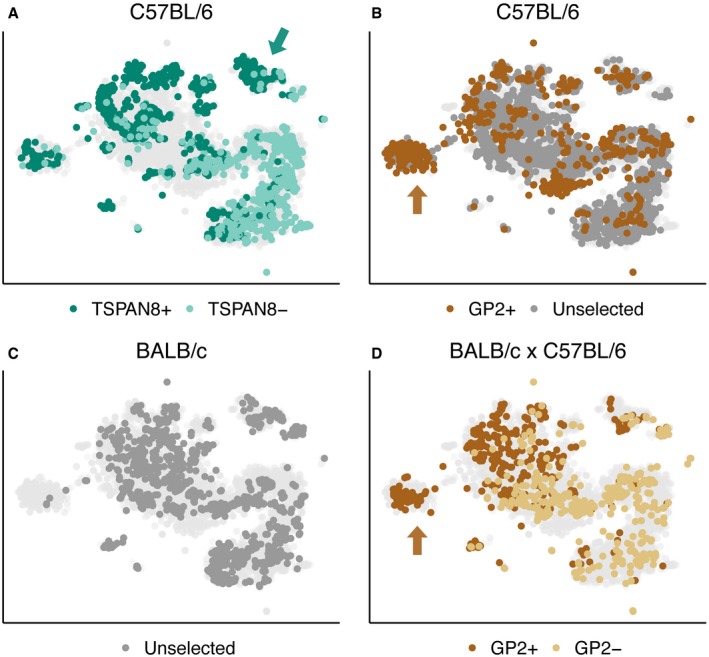
Figure 3. Cell subpopulations are reproducible across different experiments, mouse strains and cell surface phenotypes.
-
A–Dt‐SNE visualisations of individual datasets from the current study, overlaid on the combined dataset (light grey). Each dot represents an individual mTEC coloured as follows: Unselected: dark grey; TSPAN8+: dark green; TSPAN8−: light green; GP2+: dark brown; GP2−: light brown. (A) 794 TSPAN8+ and 935 TSPAN8− mTEC from C57BL/6 mice; green arrow identifies TSPAN8 preferred cluster. (B) 549 GP2+ and 2,561 unselected mTEC from C57BL/6 mice; brown arrow identifies GP2 preferred cluster. (C) 1,208 unselected mTEC from BALB/c mice. (D) 452 GP2+ and 395 GP2− mTEC from BALB/c × C57BL/6 F1 mice; brown arrow identifies GP2 preferred cluster. The whole space has good representation in most samples with the notable exception of the GP2+ enriched region (brown arrow in panel B&D), which is underrepresented in the unselected cells from BALB/c due to a combination of fewer TEC analysed and the lack of enrichment for antigen‐positive TEC (such as in the TSPAN8+ or GP2+ experiments).