
Figure 6. Robust gene co‐expression modules indicate that mTEC gene co‐expression has order.
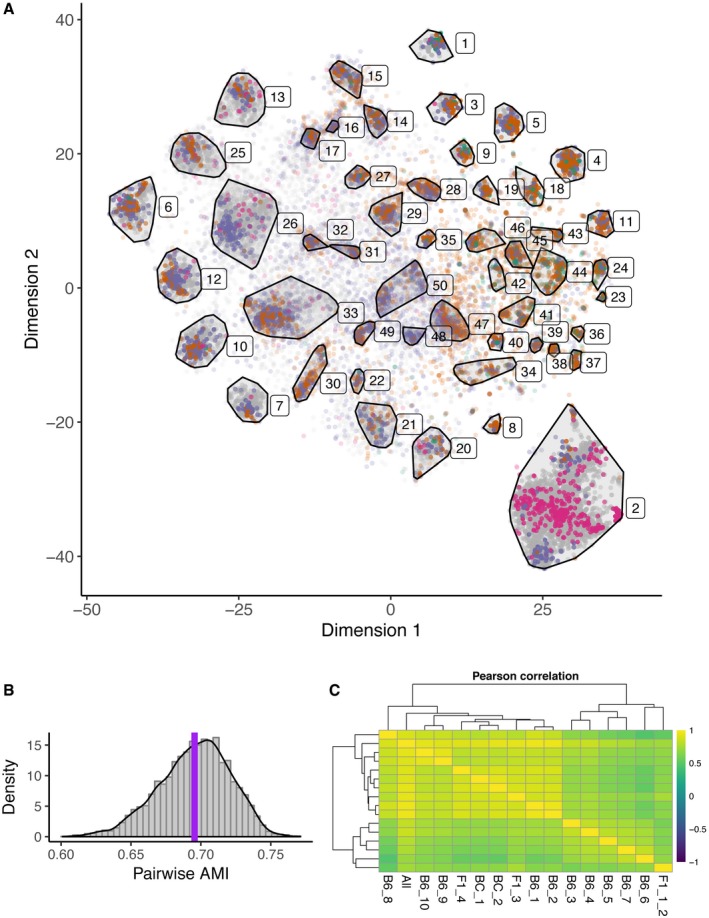
- t‐SNE visualisation of the partition of 22,819 genes into 50 mutually exclusive gene modules. Each dot represents a gene and is coloured according to gene expression category (AIRE‐dependent, AIRE‐enhanced, AIRE‐independent TRG, Other, Housekeeping, Unclassified) as described in Fig 7A. The colour intensity of each dot/gene is proportional to its membership probability within each module.
- Histogram of adjusted mutual information (AMI) between random samples. The mean AMI value is indicated by a vertical purple line; AMI values lie between 0 and 1.
- Pearson correlation of co‐expression frequency for pairs of TRGs (AIRE‐regulated and AIRE‐independent) between individual mice or all mice pooled together (see Table EV1 for mouse identifiers). Mean correlation = 0.75, with the largest divergence observed between samples with higher read depth (B6_3‐B6_7, and F1_1_2).