
Figure 8. GP2+ or TSPAN8+ mTEC are not spatially clustered but instead dispersed randomly within medullary islands.
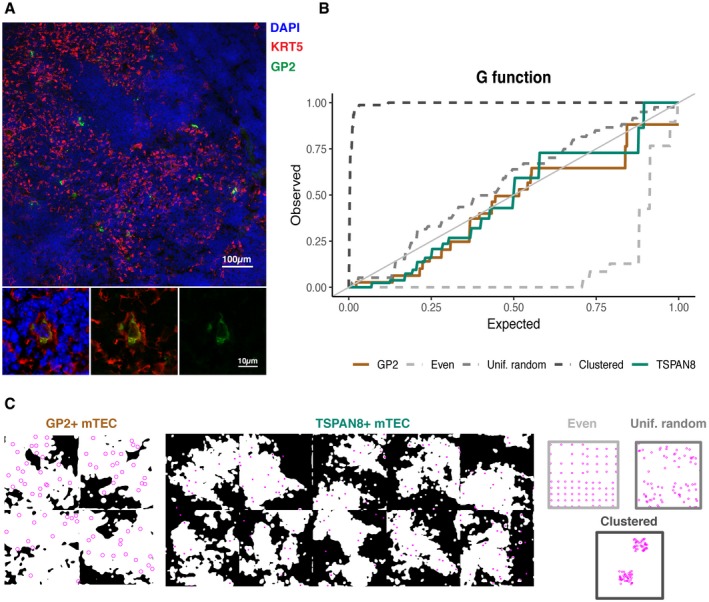
- Representative microscope image showing GP2+ mTEC. GP2 is stained in green and KRT5, which marks mTEC, in red. Scale bar 100 μm. Zoomed images in the lower panels show the overlap of GP2 and KRT5 for one GP2+ mTEC. Scale bar 10 μm.
- Observed vs. expected G‐function for GP2 (brown) and TSPAN8 spacing (green) and exemplar spacings.
- Masked medullary region (white) for four slides stained as in (A) with GP2+ mTEC as magenta circles and ten slides stained for TSPAN8, with TSPAN8+ mTEC as magenta dots (note: the upper left GP2+ mask corresponds to the image in panel A). Exemplar distributions for comparison (coloured as in B).