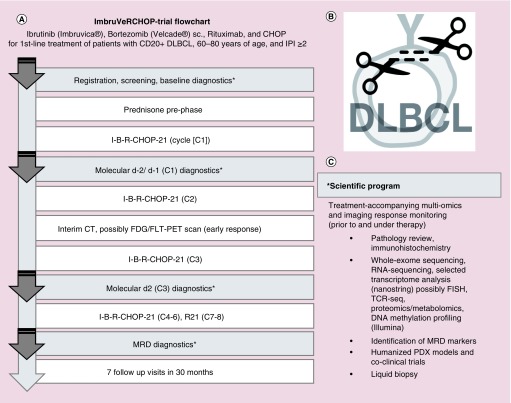
Figure 1. . Flow chart of the trial sequence and time points of scientific program.
(A) Flow chart showing the course of the study and when material for molecular analysis will be collected. (B) Study logo with double scissors for twofold target in B-cell receptor signaling. (C) Listing of molecular analyses.
*Scientific program.
CT: Computed tomography; DLBCL: Diffuse large B-cell lymphoma; FISH: Fluorescence in situ hybridization; MRD: Minimal residual disease; PDX: Patient-derived xenograft; PET: Positron emission tomography; sc.: Subcutaneous; TCR-seq: T cell receptor sequencing.

