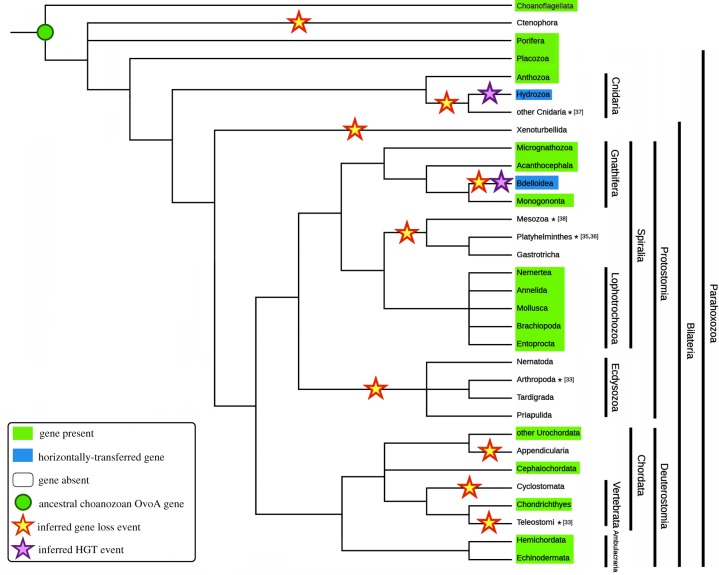
Figure 2.
Taxonomic spread of OvoA in metazoans. The diagram is a representative of OvoA distribution in the currently accepted metazoan tree of life. Presence, absence, gene loss and HGT events have been inferred through the analysis of genome and transcriptome data. Documented massive gene loss and genome reduction events are marked with an asterisk and the numbers between square brackets indicate the bibliographic reference. (Online version in colour.)

