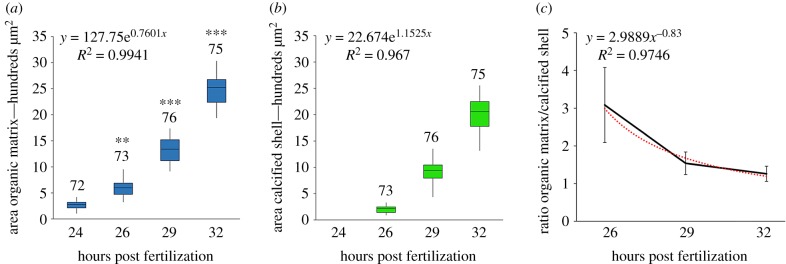
Figure 2.
Boxplots of data obtained from measurements of the areas (µm2) occupied by the shell matrix (a) and calcified shell (b) in mussel larvae from 24 to 32 hpf (single valve measurements per larva). The total number of individuals (from at least five parental pairs) analysed per time point is reported. The two structures show a similar exponential trend in growth, with the area of organic matrix statistically larger than that of the calcified shell at all times post fertilization. Statistical differences at each time post fertilization are reported in (a): **p ≤ 0.01; ***p ≤ 0.001. In (c) data are reported showing the exponential decrease in the ratio organic matrix/calcified shell at different times post fertilization. (Online version in colour.)

