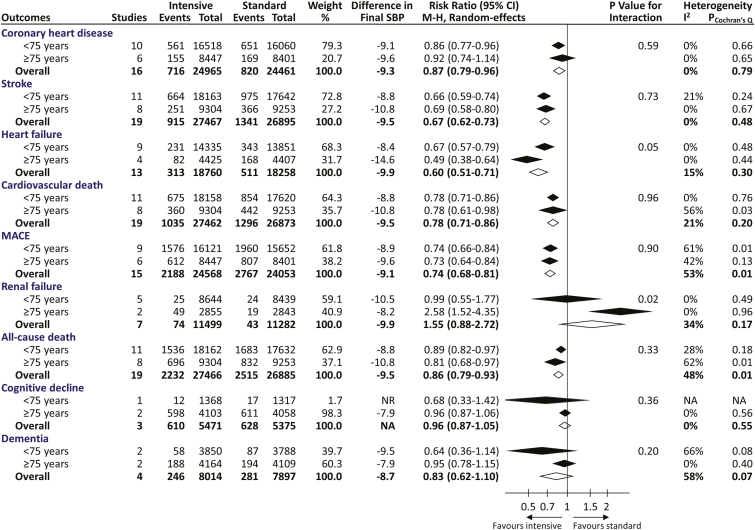
Figure 2.
Effects of blood pressure-lowering treatment on various adverse outcomes, stratified by baseline mean ages of the included trials. Difference in final SBP indicates achieved SBP difference between intensive and standard control groups and was estimated by averaging the means of every trial weighted by the number of participants. P value for testing heterogeneity of the risk ratios across age groups is provided. Diamond represents the pooled estimate of relative risks and its 95% confidence interval. MACE, major adverse cardiovascular events; NA, not applicable; NR, not reported

