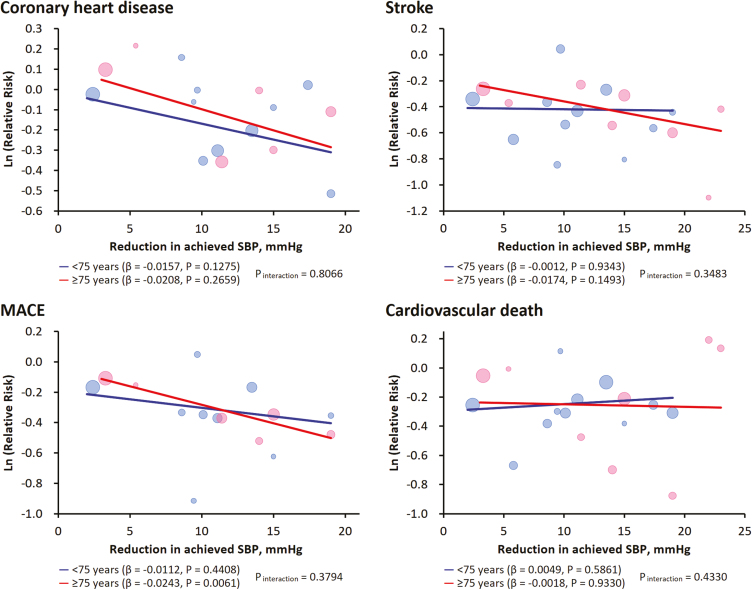
Figure 3.
Meta-regression analyses of treatment effect in relation to achieved systolic blood pressure (SBP) reduction for various adverse outcomes, stratified by baseline mean ages of the included trials. The regression fits for two age groups are shown. The size of the circle represents the weight of each trial and is inversely proportional to the standard error of the effect estimate. Ln, natural logarithm; MACE, major adverse cardiovascular events.

