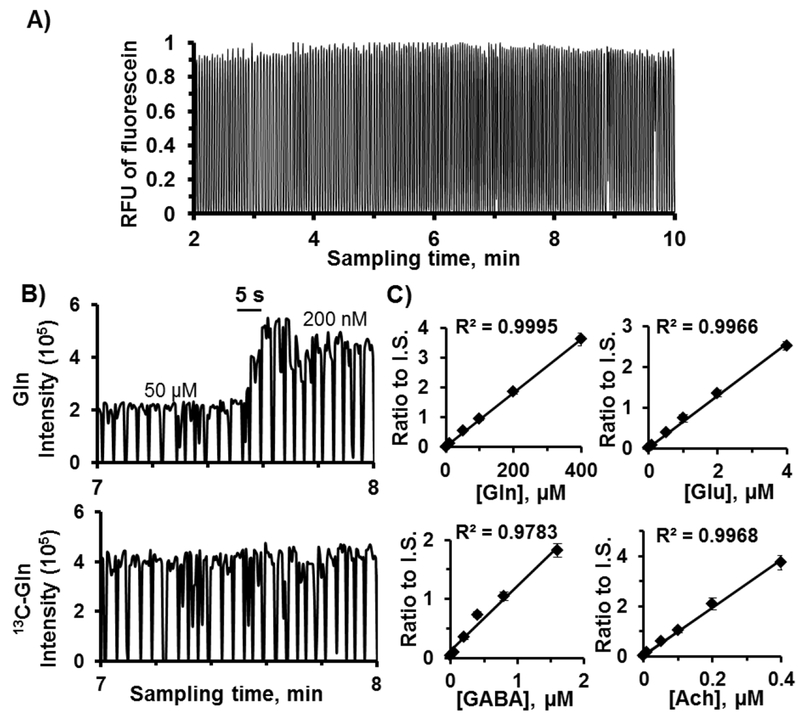
Figure 3.
In vitro characterization of sampling coupled to segmented flow and reagent addition. Samples were a mixture of standards in aCSF and reagents contained fluorescein and a mixture of internal standards. A) Detection of fluroescein in droplets yielded peak heights with RSD of 3% (n = 3 device sets). An example of a step change of ACh during switching concentration is shown in (B) along with related internal standard added at the same period. C) Calibration curves from ratio of signal traces of standards to internal standards. Linear calibration curves were achieved.

