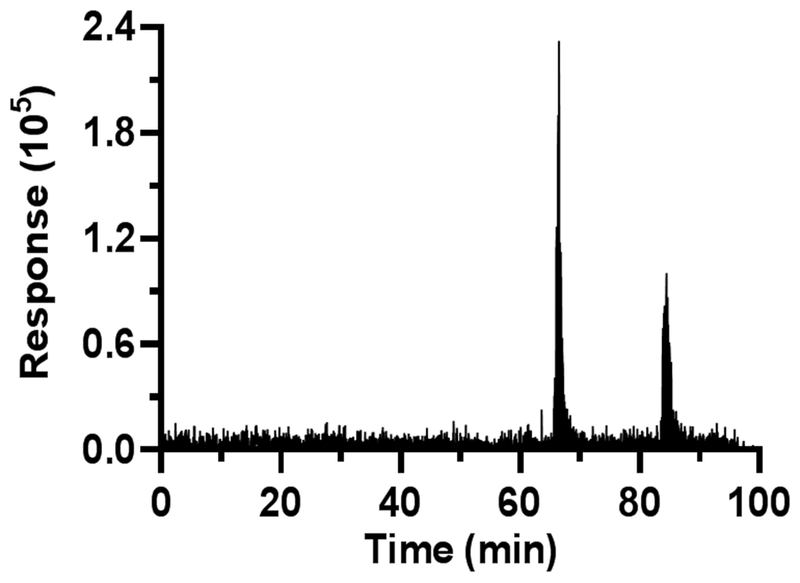
Figure 6.

Raw MS/MS data for GABA from in vivo collection. ~4.5 nL brain samples (volume was ~7 nL after addition of internal standard) were infused with segmenting fluid at 50 nL/min for 100 min, corresponding to about 400 samples. The two increases in signal correspond to K+ infusions. Time axis is time for analysis and is not corrected to sampling time.
