Fig. 4.
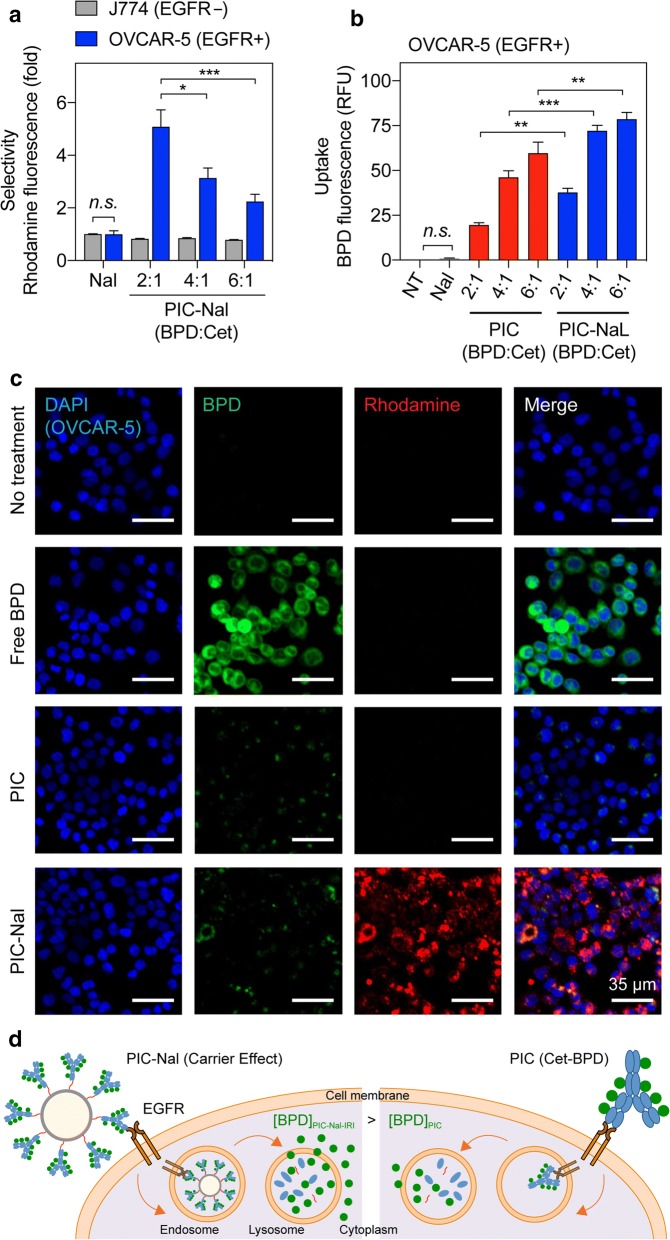
Selective binding, uptake, and imaging of PIC–Nal in cancer cells. a The selectivity of PIC–Nal was assessed in EGFR(−) J774 and EGFR(+) OVCAR-5 cells after 30 min of incubation. Nal alone was used as a control. The BPD:Cet ratio of PIC was varied (2:1, 4:1, 6:1). b The uptake of PIC–Nal and PIC in OVCAR-5 cells was assessed at 24 h after incubation, based on intracellular BPD fluorescence signal. c Representative fluorescence images of OVCAR-5 incubated with BPD, PIC, or PIC–Nal for 24 h. The BPD:Cet ratio of PIC was fixed at 6:1. Fluorescence signal of the nuclei (DAPI), BPD, and nanoliposome (rhodamine) shown in blue, green, and red, respectively (scale bar = 35 µm). d Depiction of the ‘carrier effect’ of PIC–Nal in EGFR(+) cancer cells. (n > 3; *P < 0.05, ***P < 0.001; n.s.: not significant; one-way ANOVA, Tukey’s posthoc test)

