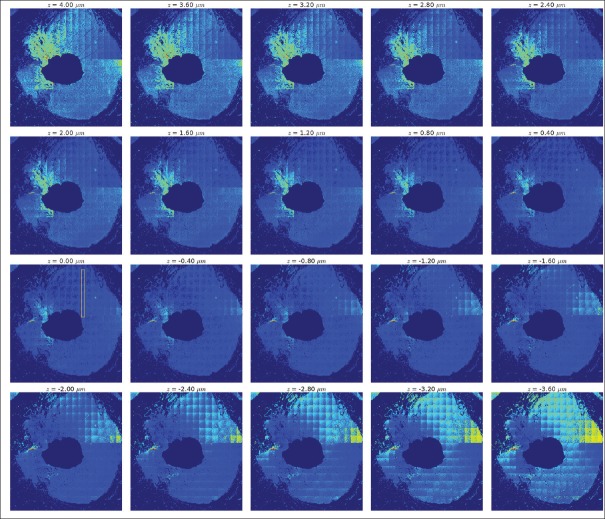
Figure 10.
ConvFocus predictions for z-stack scans from a lymph node biopsy of a colon cancer case. This is the middle lymph node in Figure 3b. WSIs were acquired in z-stack mode on a NanoZoomer S360 ranging from +4 μm (top left) to −3.6 μm (bottom right) in 0.4 μm increments. z = 0 μm indicates the scanner-determined “in-focus” plane. Plots of the OOF predictions for patches in the white rectangle in the z = 0 μm are shown in Figure 10

