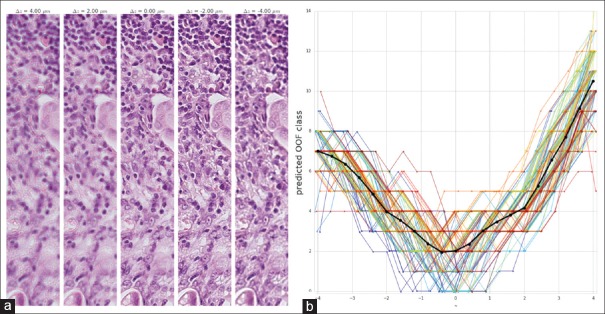
Figure 7.
Z-stack examples and OOF predictions along z-axis. (a) Sample high magnification views at different z-levels. (b) Predicted OOF class plotted against z-level for 114 patches from the white rectangle in the z = 0 μm panel of Figure 9. Jitter has been added in the x and y dimensions for better visualization. Different colors are used to clearly indicate different patches. Mean class predictions across these patches are shown in black to highlight the average trend. Spearman's rank correlation rho between the absolute value of z and mean class predictions averages are: >0.999 for z ≤ 0 and 1.0 for z ≥ 0 (P < 0.001 for both). OOF: Out-of-focus

