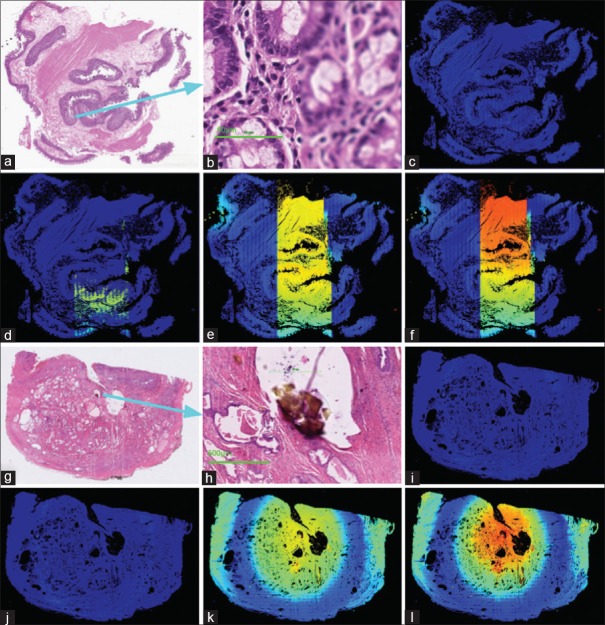
Figure 8.
Qualitative assessment of the impact of each step in our semi-synthetic OOF data generation process. (a and g) Slide images of a duodenum and prostate specimen. (b and h) Magnified views of regions with OOF artifacts of panels a and g, respectively. (c-f and i-l) Algorithm-predictedOOF classes; color map is shown in Figure 2d. Four different configurations were applied [Table 2]. (c and i) Algorithm trained with Gaussian blurring and brightness perturbations only. (d and j) Model trained with simulated JPEG artifacts in addition. (e and k) Algorithm trained with simulated Poisson noise in addition. (f and l): Algorithm trained with Bokeh blurring instead of Gaussian. OOF: Out-of-focus

