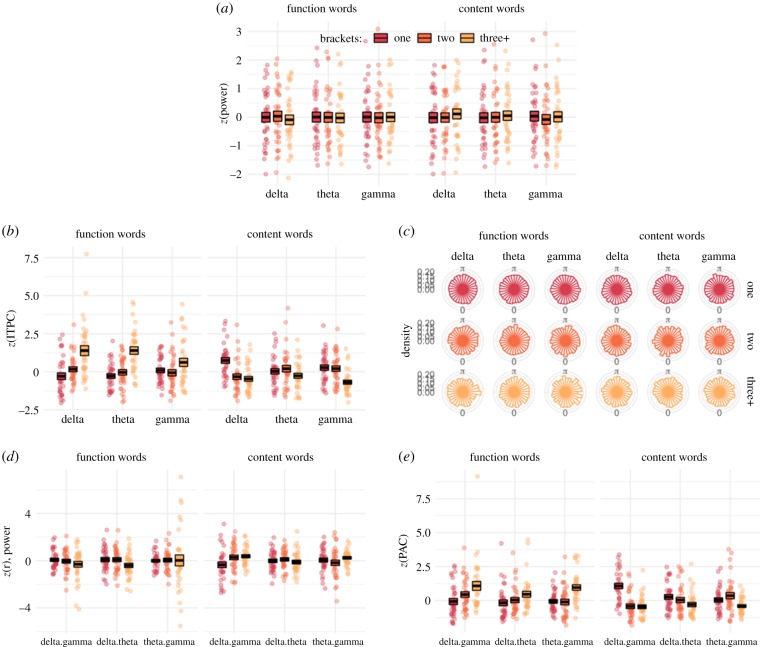
Figure 2.
(a) Power at word onset in three frequency bands, divided into function and content words. Points indicate individual averages per participant, and boxes indicate the group mean ± 1 s.e. (b) Inter-trial phase consistency (ITPC) across three frequency bands for function and content words. (c) Circular histograms of single-trial phase in each of three phrase bins (rows) for three frequency bands separated by function and content words (columns). (d–e) CFC as measured by P-P correlations (d) or PAC (e) across three frequency pairs.

