
Figure 2.
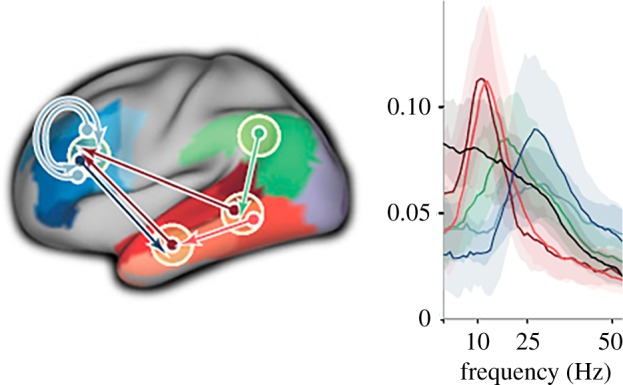
Schematic of the directed rhythmic cortico-cortical interactions between temporo-parietal and frontal cortex, grouped according to the cortical output area. The coloured arrows refer to the power spectra shown on the right (adapted from [44]). (Online version in colour.)