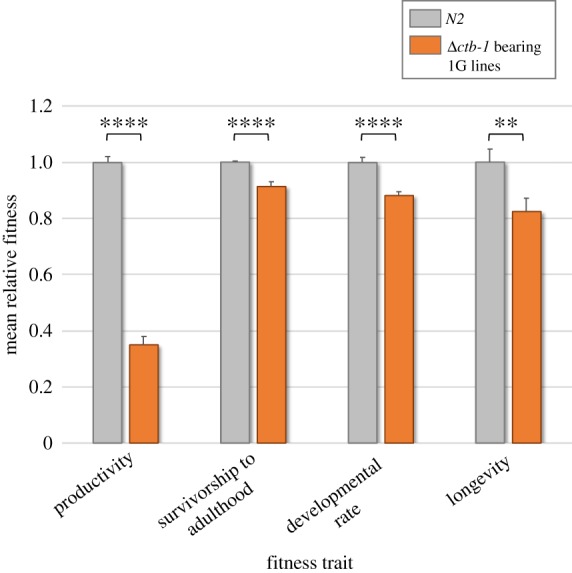
Figure 3.

Relative trait means of Δctb-1 bearing 1G replicate lines and the WT N2 control. Mean fitness values for each of the four traits were measured across six 1G lines (orange), each with 15 replicates where possible (n = 87 or 90) and three N2 control lines (grey), each with 15 replicates (n = 45). Phenotypic assays were conducted for four fitness-related traits, namely productivity, survivorship to adulthood, developmental rate and longevity. For simplicity, the mean relative fitness value for each of the four traits in the WT N2 control was scaled to a value of 1. All of the lines bearing the Δctb-1 mtDNA perform significantly worse than the WT N2 line. **p ≤ 0.01, ****p ≤ 0.0001. Error bars represent one standard error. (Online version in colour.)
