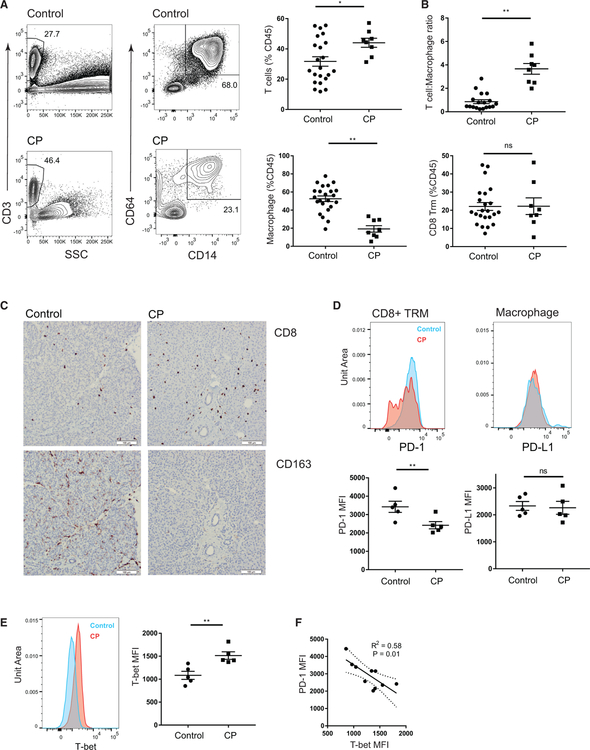
Figure 7. Alterations in Pancreatic Immune Cell Composition and T Cell Regulation in Patients with Chronic Pancreatitis.
Samples of unfractionated pancreatic cell suspensions were obtained from research subjects undergoing total pancreatectomy with auto-islet transplantation.
(A) Pancreas immune cells from patients with CP and age-matched organ donor controls without evidence of pancreatic disease. Shown are representative (left) and compiled frequencies (right, ±SEM) of total T cells (first column, gated on DAPIloCD45+CD3+ cells) and macrophages (second column, gated on DAPIlo CD45+Lin(CD19/20/56/15/16/66b)−CD14+CD64+ cells).
(B) Graphs of compiled data show the T cell to macrophage ratio (top) and frequencies of CD8+ TRMs (bottom, gated on DAPIloCD45+CD3+CD8+CD45RA− CCR7−CD69+) in control and CP pancreata. Data shown are from 19 controls and 8 CP patients.
(C) Representative micrographs (203 magnification) of single-color immunohistochemistry showing CD8 (top) and CD163 (bottom) staining in control (left) and CP pancreas (right). White bar, 100 µm for scale.
(D) Expression of PD-1 on CD8+ TRMs (left) and PD-L1 on macrophages (right) from pancreas of control (blue) and CP patients (red) shown in representative histograms (top), with graphs of compiled mean fluorescence intensities (MFIs).
(E) Expression of T-bet in CD8+ TRMs is shown from pancreas of controls (blue) and CP patients (red) in representative histograms (left) and graphs of compiled MFIs (±SEM from five controls and five CP patients). **p < 0.01, *p < 0.05 as calculated by unpaired t test.
(F) Linear regression showing the relationship between PD-1 and T-bet MFI on pancreas CD8+ TRMs of CP patients and controls with 95% confidence bands of the best-fit line.
See also Figure S7.

