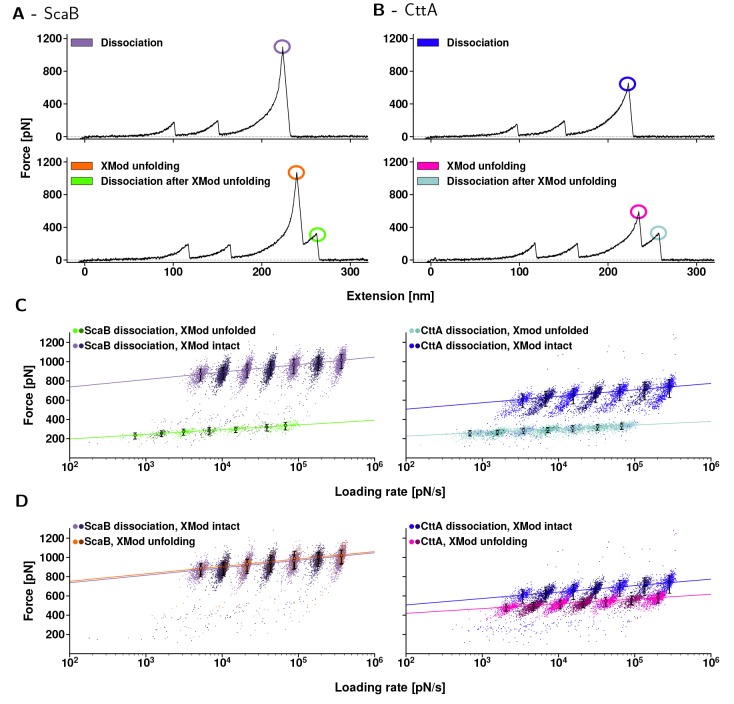
Figure 4.
Dynamic force spectra of CttA-XDoc:CohE (left) ScaB-XDoc:CohE (right). (A, B) Typical force–extension traces. First, both CBM-domains unfolded. Their known unfolding behavior served as a fingerprint, indicating that single molecular complexes were probed. Then, for both ScaB-XDoc:CohE and CttA-XDoc:CohE, Xmod remained either folded until complex rupture (upper traces, purple and blue) or unfolded (lower traces, orange and pink) prior to complex rupture. When Xmod unfolding occurred, both complexes ruptured at markedly lower forces (bright green and teal). (C, D) Dynamic force spectra for each class of unfolding or unbinding events that are encircled in (A, B). The colors match the corresponding events in (A, B), and a different color saturation was chosen for every other pulling speed to display the resulting populations more clearly. Data were fitted with the two-state Bell–Evans model. (C) Complex rupture forces. In cases where Xmod remained folded, the ScaB-XDoc:CohE complex ruptured at markedly higher forces than did CttA-XDoc:CohE over the entire range of loading rates tested (purple vs blue). When the Xmod unfolded, the complexes showed nearly identical rupture behavior (bright green vs teal). (D) Comparison of the peak forces reached in both unbinding pathways. The data points either stem from complex rupture events for traces lacking Xmod unfolding, or from unfolding of the Xmod. Interestingly, the most probable unfolding force of ScaB’s Xmod is about the same as the ScaB-XDoc:CohE complex dissociation forces that occur when Xmod remained intact (orange vs purple). The same was not true for CttA-XDoc:CohE, where Xmod unfolding forces were surpassed by complex dissociation forces with no prior Xmod unfolding (blue vs pink). The likelihood of observing Xmod unfolding prior to complex unbinding was only 7% for ScaB-XDoc, as compared to 43% for CttA-XDoc.

