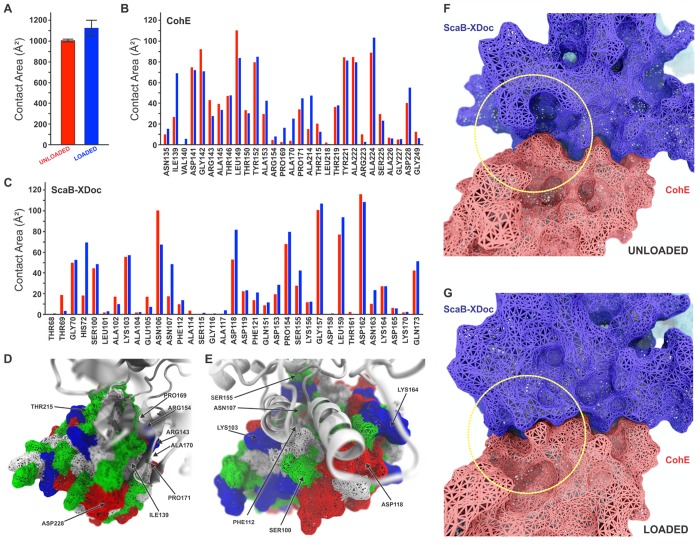
Figure 5.
Analysis of ScaB-XDoc:CohE binding interface under force from SMD. (A) Average contact surface area between CohE and ScaB-XDoc under unloaded and loaded conditions. The contact area increases under force load condition. The contacts were calculated using PyContact from 4 ns trajectory windows that were combined for all 75 trajectories. Standard deviations were calculated from these combined windows and are presented as error bars. (B) Surface contact area of interacting residues of CohE under unloaded (red) and loaded (blue) conditions. (C) Surface contact area of interacting residues of Doc under unloaded (red) and loaded (blue) conditions. (D,E) Surface of Doc (D) and Coh (E) showing main interface residues. Hydrophobic residues are shown in white, polar residues in green, and negative and positive residues in red and blue, respectively. (F,G) Rearrangement of binding residues of Coh (red) and Doc (blue) under force. The yellow circle shows the region of the binding interface where a rearrangement increases the contact surface from the unloaded (F) to the loaded (G) configurations.

