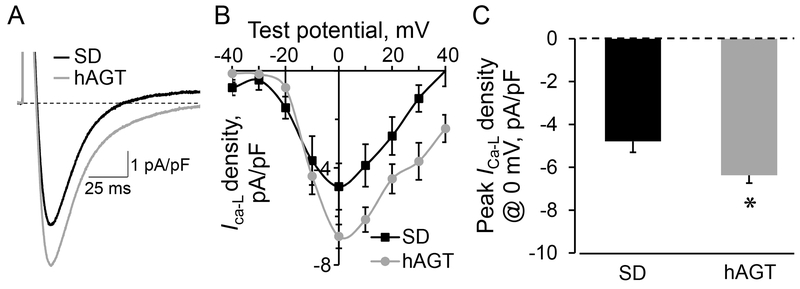
Figure 1.
A, Representative examples of peak ICa-L tracings recorded in cardiomyocytes isolated from SD and TGR(hAGT)L1623 (hAGT) rat hearts under control conditions. Dotted horizontal line indicates zero current level. B, L-type Ca2+ channel voltage-current (V-I) relationship obtained from SD and TGR(hAGT)L1623 (hAGT) cardiomyocytes. C, Mean and SEM values of peak ICa-L for SD (n=13) and hAGT (n=28) cardiomyocytes. * denotes p < 0.01 compared to SD.

