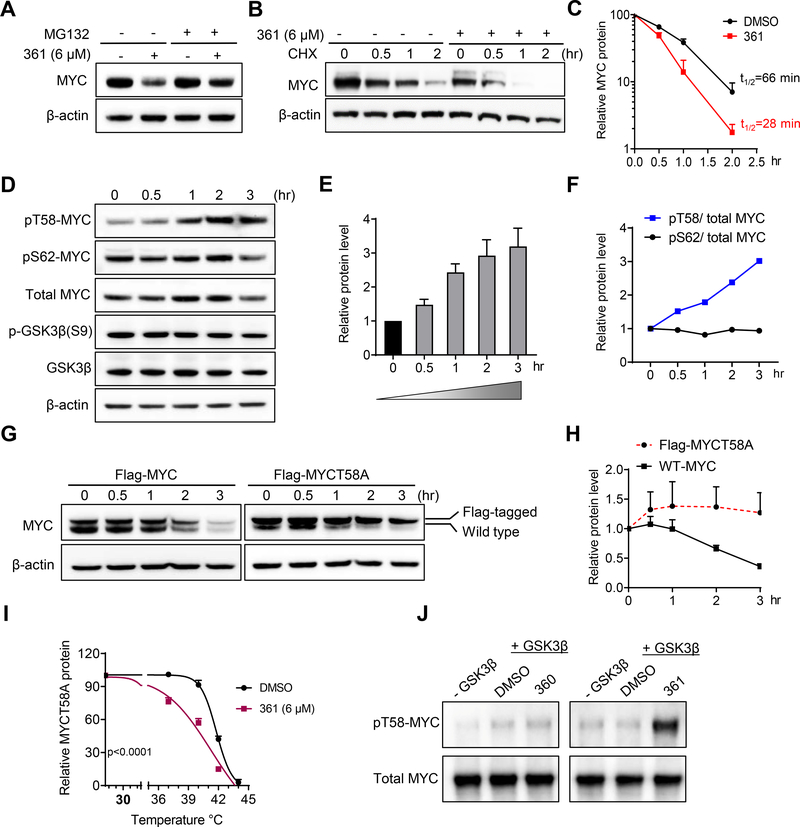
Figure 2.
361 Decreases MYC Protein Stability by Modulating MYC-threonine 58 Phosphorylation
(A) MYC protein levels in PC3 cells treated with 361 in the absence or presence of proteasome inhibitor MG132 determined by western blot.
(B) PC3 cells were pretreated with 361 or DMSO for 3 hr, followed by cycloheximide (CHX) treatment. Cells were harvested at indicated time points and MYC levels determined by western blot.
(C) MYC protein degradation kinetic curves based on the quantification of MYC levels in (B).
(D) Western blots for MYC, phosphorylated MYC T58 and S62, GSK3β and phosphorylated GSK3β S9 in 361 treated PC3 cells at indicated time points.
(E and F) Ratios of pT58 to pS62 (E) and pT58 or pS62 to total MYC protein levels (F) from experiment in (D).
(G and H) Western blot analysis (G) and quantification (H) of Flag-tagged MYC T58 alanine mutant (Flag-MYCT58A) or Flag-tagged wild-type MYC (Flag-MYC) levels in PC3 cells stably expressing the indicated constructs after 361 (6 μM) treatment at the indicated time points.
(I) Melt curve of MYCT58A in MYCT58A-expressing PC3 cells treated with DMSO or 361 at indicated temperature points in CETSA.
(J) Phosphorylated MYC T58 levels by GSK3β were assessed by western blot in in vitro kinase assay where recombinant MYC was first phosphorylated on S62 by activated recombinant ERK2, then incubated with GSK3β kinase and 6 μM of 361 or inactive analog 360.
Error bars represent mean ± SEM, n = 3 independent experiments for (C, E, H and I), n = 2 independent experiments for (F), Half-life of MYC protein calculated by “one phase decay” analysis in Prism for (C), and analyzed by two-way ANOVA in Prism for (I). Data are representative of two independent experiments with similar results for (J).

