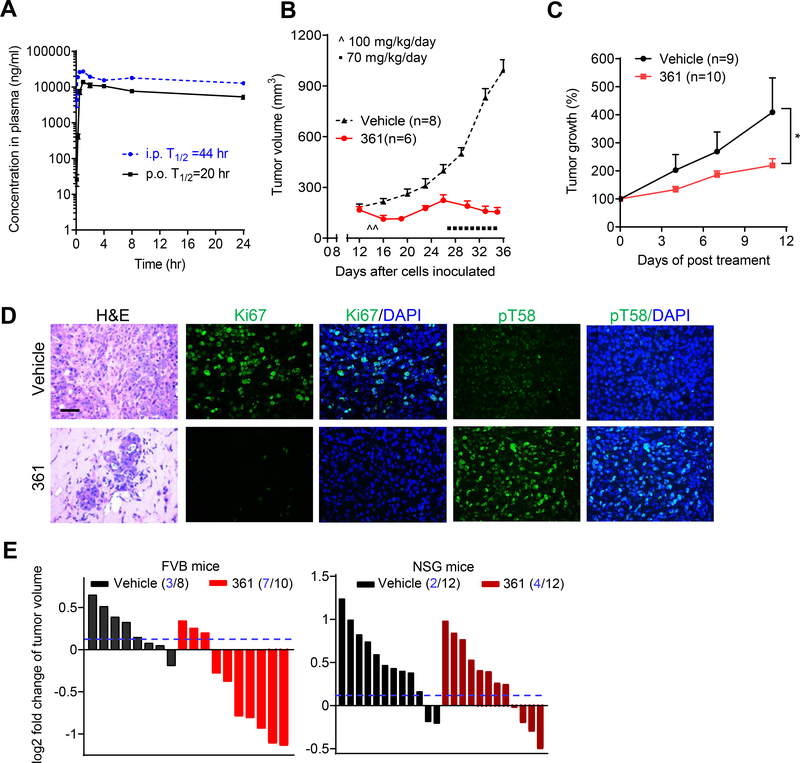
Figure 4.
361 Shows Favorable Pharmacokinetics and Inhibits MYC-dependent Tumor Growth in Vivo
(A) Pharmacokinetic (PK) analysis in C57BL/6 mice treated p.o. or i.p. with 50 mg/kg of 361. Plasma concentration of 361 was determined at the indicated time points up to 24 hr after a single dose administration.
(B) Average tumor volumes of MycCaP allografts in FVB mice after treatment with 361 initially at 50 mg/kg twice daily for 2 days, then 70 mg/kg/day for 9 days as indicated.
(C) Average of tumor growth percentage of human prostate cancer patient derived xenografts (PDX) after 361 treatment (55 mg/kg/day, 3 consecutive days a week for 2 weeks).
(D) Representative images of H&E and IF staining for Ki67 and pT58 in MycCaP tumor tissue after 361 treatment from the study in (B) (scale bar, 50 μm).
(E) Tumor volume fold change of MycCaP allografts in FVB mice and xenografts in NSG mice after 4 days treatment with 361 at 50 mg/kg/day. Dotted line indicates threshold of 10% of fold change and numbers in parentheses indicate how many tumors were under the 10% threshold out of total number of tumors.
Error bars represent mean ± SEM, n = 3 mice at each time point in (A), n = 6–8 grafts/group (from 3–4 mice) in (B and D), n = 9–10 grafts/group (from 5 mice) in (C) from two independent experiments, n = 8–12 grafts/group (from 4–6 mice) in (E), and analyzed by two-way ANOVA in Prism for (C). *p < 0.05.

