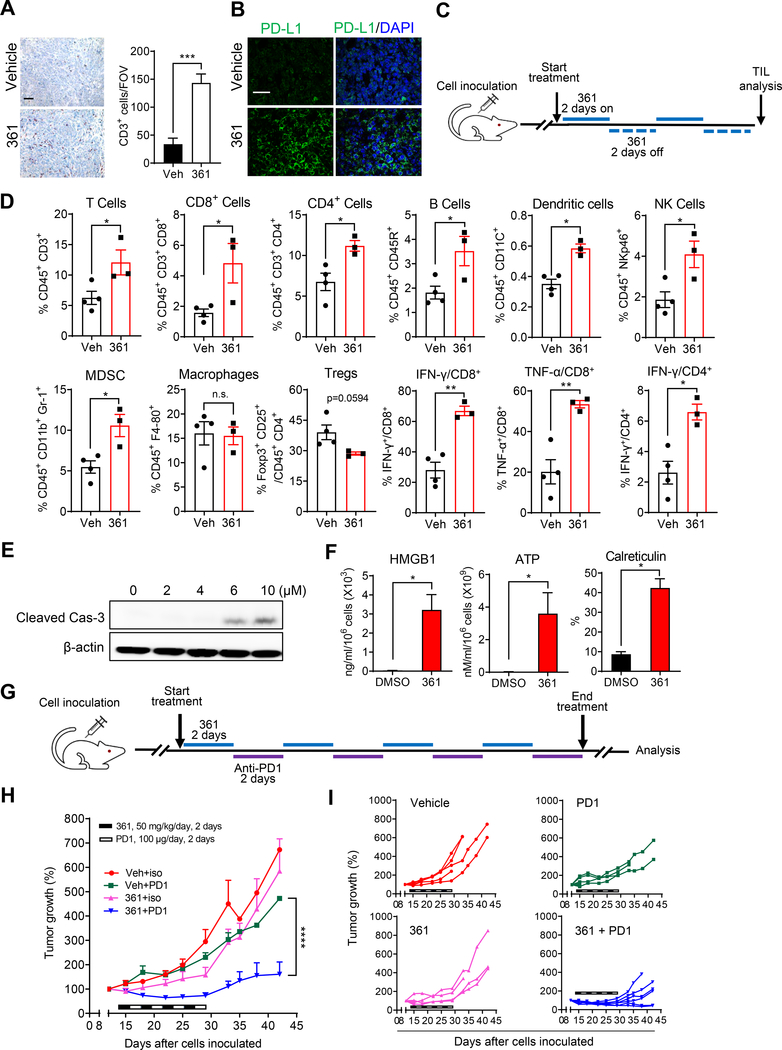
Figure 5.
361 Modulates the Tumor Immune Microenvironment and Potentiates Anti-PD1 Immunotherapy
(A) Representative IHC staining of CD3 in the MycCaP tumor tissue after 361 treatment from the study in Figure 4B (scale bar, 50 μm), and the quantification of CD3 positive cells per field of version (FOV).
(B) Representative IF images of PDL-L1 staining in the MycCaP tumor tissue after 361 treatment from the study in Figure 4B (scale bar, 50 μm).
(C) Scheme for tumor immunophenotyping from FVB mice bearing established MycCaP allografts treated with 361 (50 mg/kg/day, 2 days on/2 days off for 2 rounds). TIL, tumor infiltrating lymphocytes.
(D) Flow cytometry analysis of immune cells in MycCaP allografts treated with 361 or vehicle as described in (C), shown by percent of parent gates.
(E) Western blot analysis shows cleaved Caspase-3 in 361 treated MycCaP cells for 48 hr.
(F) Immunogenic cell death (ICD) was assessed in vitro in MycCaP cells treated with 4 μM 361 for 72 hr via HMGB1 release (ELISA), ATP release (luminescence assay), and cell surface calreticulin expression (flow cytometry). Data are representative of two independent experiments with similar results.
(G) Scheme for combination treatment of 361 with anti-PD1 antibody in MycCaP allografts. FVB mice bearing established MycCaP tumors were treated with alternating doses of 361 at 50 mg/kg/day for 2 days, then anti-PD1 or IgG2a isotype control at 100 μg/day for 2 days, for a total of 4 cycles.
(H) Average of tumor growth percentage of the grafts under the combination treatment described in (G).
(I) Individual tumor growth trajectories of study in (H).
Error bars represent mean ± SEM, n = 4–6 grafts/group (from 3 mice) and 6 FOVs/group were analyzed in in (A) and (B), n= 3–4 mice/group in (D), n = 3 replicates in (F), and n = 4–6 mice/group in (H), and analyzed by unpaired t test for (A), (D) and (F), and two-way ANOVA for (H) in Prism. *p < 0.05, **p < 0.01, ***P < 0.001, ****p < 0.0001.
See also Figure S6

