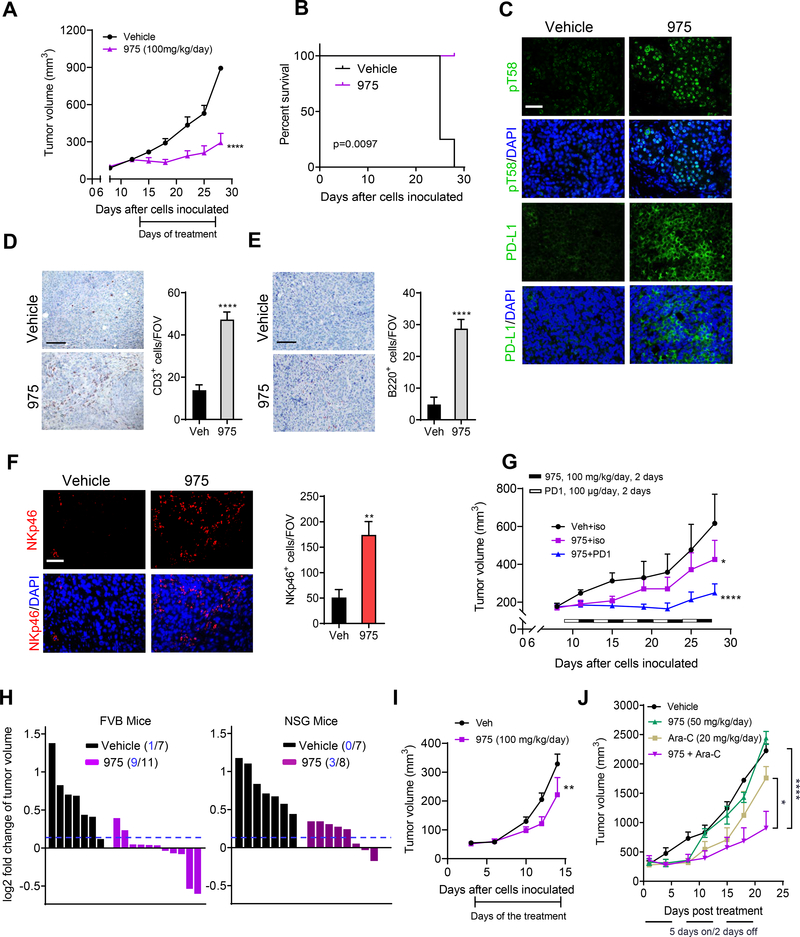
Figure 8.
975 Inhibits Tumor Progression, Increases Immune Cell Infiltration and Potentiates Anti-PD1 Immunotherapy
(A) Average tumor volumes of MycCaP allografts after treatment with 975 at 100 mg/kg/day for 14 days.
(B) Survival curves of animals from the study shown in (A).
(C) Representative images of MYC pT58 and PD-L1 levels assessed by IF in the tumor tissues from the study in (A) (scale bar, 50 μm).
(D) Representative images of CD3 by IHC and quantification of the positive cells/FOV in the tumor tissues from the study in (A) (scale bar, 100 μm).
(E) Representative images of B220 by IHC and quantification of the positive cells/FOV in the tumor tissues from the study in (A) (scale bar, 100 μm).
(F) Representative images of NK cells (NKp46+) by IF and quantification of the positive cells/FOV in the tumor tissues from the study in (A) (scale bar, 50 μm).
(G) Average tumor volumes of MycCaP allografts after treatment with alternating doses of 975 at 50 mg/kg, twice daily for 2 days, then anti-PD1 for 2 days for a total of 5 cycles.
(H) Fold change of tumor size of MycCaP allografts in FVB mice and xenografts in NSG mice after 3 days treatment with 975 at 50 mg/kg, twice daily. Tumor numbers under the 10% threshold out of total number of tumors in each group indicated.
(I) Average tumor volumes of LLC1 allografts in C57BL/6 mice after treatment with 975 at 50 mg/kg, twice daily for 12 days.
(J) Average tumor volumes of MV411 xenografts after treatment with lower dose 975 (50 mg/kg/day) alone or combined with Ara-C (20 mg/kg/day) for 3 three weeks (5 days a week).
Error bars represent mean ± SEM n = 6–7 grafts (from 4 mice) /group in (A-F), most affected 1–3 FOVs/graft were analyzed in (D-F), n = 5–7 mice/group in (G), n = 7–11 grafts (from 4 to 6 mice)/group in (H), n = 7 mice/group in (I), n = 4 mice/group in (J). Data were analyzed by Two-way ANOVA for (A, G, I and J), by survival curve comparison for (B), by unpaired t test for (D-F) in Prism, *p < 0.05, ****p < 0.0001.

