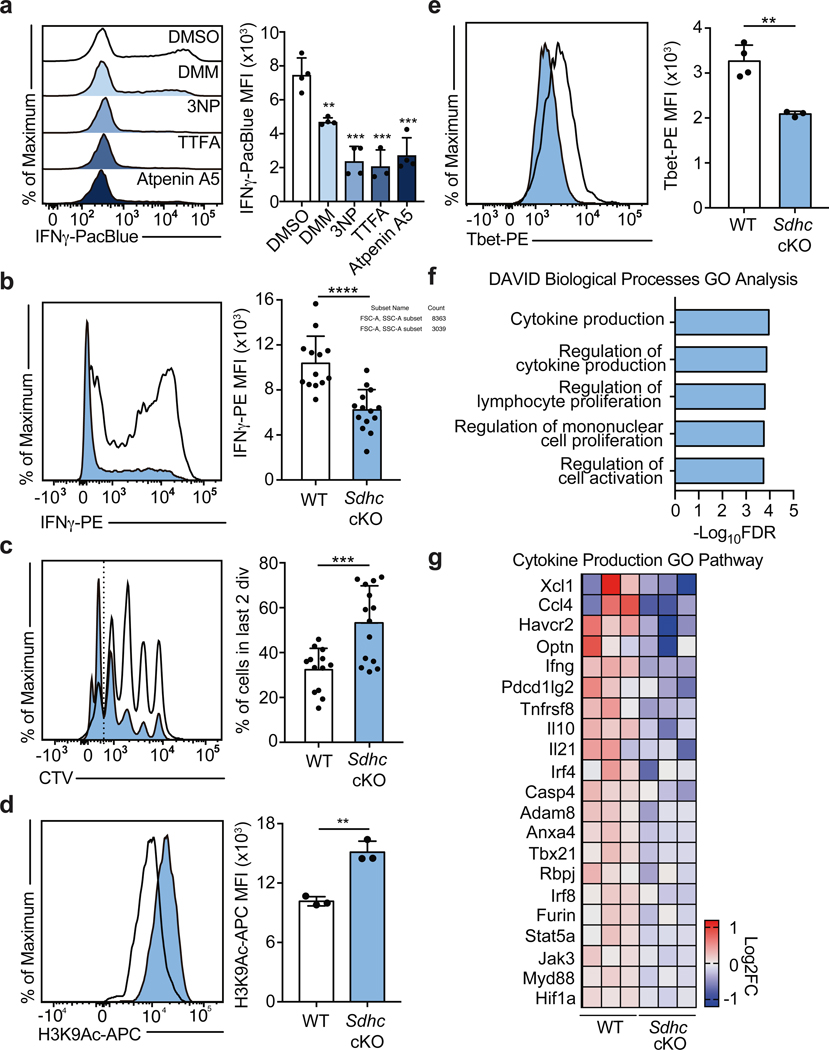
Figure 2: Complex II uncouples Th1 cell differentiation and effector function.
a, Intracellular IFNγ protein expression in PMA and Ionomycin restimulated WT CD4 T cells cultured in Th1 conditions at day 5 after overnight treatment with DMSO, DMM (10mM), 3-nitropropionic acid (3NP; 1mM), thenoyltrifluoroaceton (TTFA; 100μM), or atpenin A5 (1μM) (n = 3). b, Intracellular IFNγ protein expression and c, proliferation of CD4 T cells from doxycycline-treated Sdhcfl/fl TetO-Cre−/+ R26rtTA/+ (Sdhc cKO) or Sdhc+/+ TetO-Cre−/+ R26rtTA/+ (WT) mice cultured in Th1 conditions at day 5, (data combined from 5 independent experiments, WT: n = 13, Sdhc cKO: n = 14 biological replicates), two-tailed t-test. d, Total cellular H3K9Ac of WT and Sdhc cKO cells cultured in Th1 conditions at day 3 (n = 3), two-sided t-test. e, Tbet protein expression of WT (n = 4) and Sdhc cKO (n = 3) cells cultured in Th1 conditions at day 5, two-sided t-test. f, DAVID GO pathway analysis of genes downregulated in cKO mice compared to WT controls, p<0.05. g, Heatmap of gene expression from RNA-seq results for the Cytokine Production GO Pathway. n = number of technical replicates except where noted otherwise. Representative plots and a graph summarizing the results of at least two independent experiments are shown, except where noted otherwise. Mean and s.d. of replicates are presented on summarized plots and unpaired, two-tailed t-test used to determine significance (**p<0.01; ***p<0.001, **** p<0.0001).

