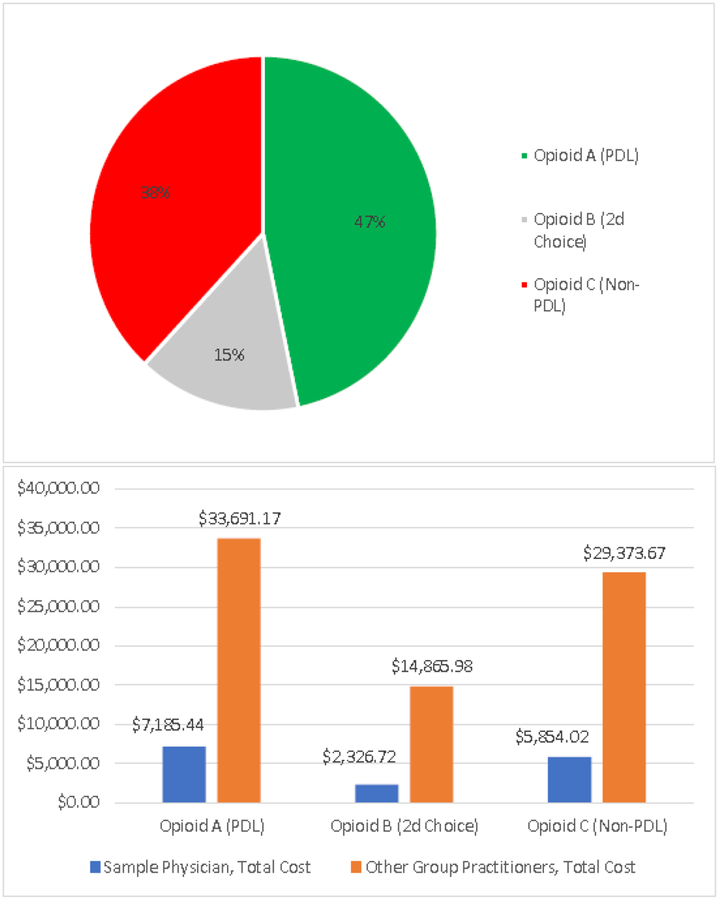
Figure 1. Sample Clinician Prescribing Profile Including Individual Prescribing Habits (PDL vs Non-PDL Prescriptions) and Comparisons to Other Group Practitioners.
Pie chart shows an individual prescriber’s adherence to PDL prescribing of opioids.
Bar graph shows that individual prescriber’s opioid costs compared to the combined total of the rest of the medical group

