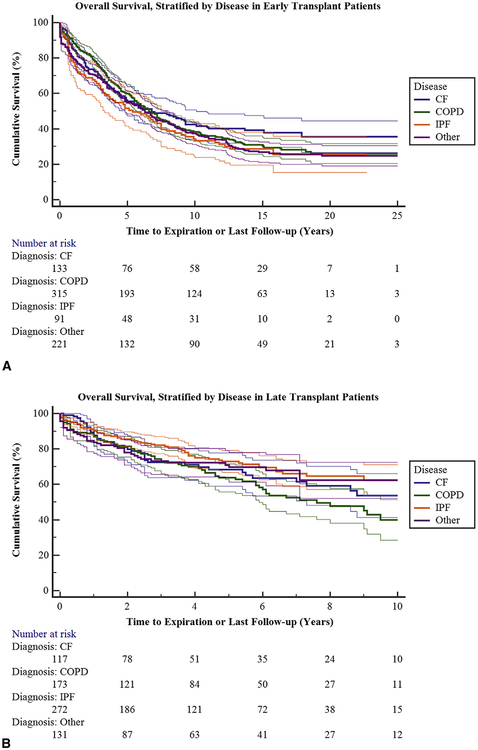
FIGURE 4.
A, Overall survival stratified by diagnosis groups in early transplant patients. Ninety-five percent confidence limits are represented by the thin lines. See Table E2 for survival and 95% confidence intervals separated by disease process. B, Overall survival stratified by diagnosis groups in late transplant patients. Ninety-five percent 95% confidence limits are represented by the thin lines. See Table E3 for survival and 95% confidence intervals separated by disease process. CF, Cystic fibrosis; COPD, chronic obstructive pulmonary disease; IPF, interstitial pulmonary fibrosis.

