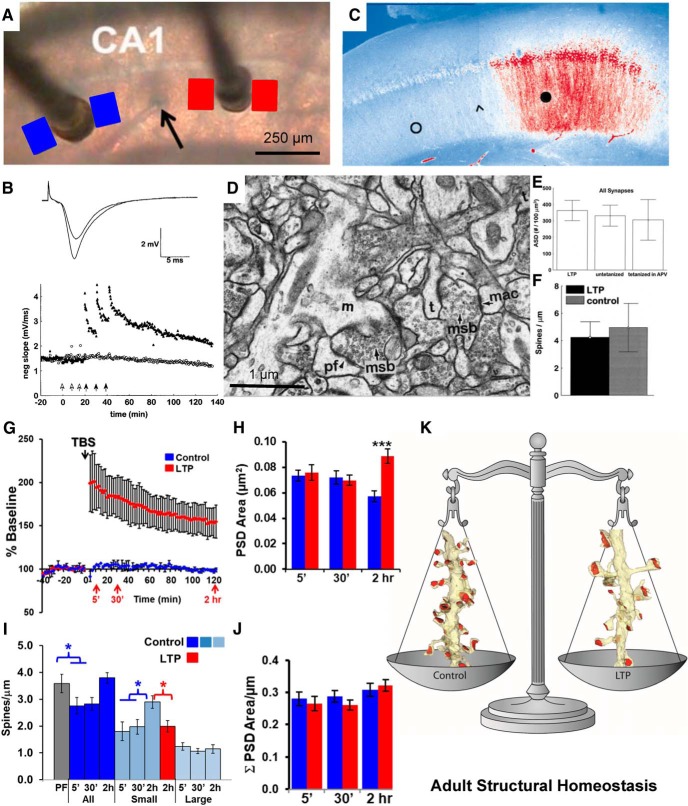
Figure 5.
Ultrastructure of long-term potentiation in the young adult rat hippocampus. A, Positioning of stimulating electrodes and sample locations for serial EM sections from the control (blue) and LTP (red) sites. The stimulating electrode that induced LTP was alternated between the CA3 (left) and the subicular (right) side of the recording electrode (black arrow). B, LTP induced by three bouts of tetanic stimulation (closed arrows, 100 Hz for 1 s each), and the control side received the same number of stimuli at a slower rate that did not induce LTP (open arrows). C, Staining for P-CaMKII after induction of LTP at the subicular stimulating electrode (black circle) illustrates increased labeling (red) of P-CaMKII relative to the control stimulation site (open circle). The arrowhead indicates the approximate location of the recording electrode, and the scale is the same as in A. Adapted from Ouyang et al. (1997). D, Illustration of the excellent brain slice ultrastructure that can be obtained from adult hippocampal slices. E, F, Examination of such slices revealed that adjusted synaptic density (ASD; E) and spines per micrometer (F) were not altered by LTP induced by tetanic stimulation B and D–F were adapted from Sorra and Harris (1998). G–I, When LTP was induced with theta burst stimulation (G), and the PSD area of synapses enlarged (H), while the increase in small-spine density seen under control conditions was absent (I). J, K, Consequently, the total PSD area after LTP induction was similar to that in control conditions (J), resulting in a homeostatic balance in total synaptic weight per unit length of dendrite (K). A, B, G, and H are adapted from Bourne and Harris (2011); I is adapted from Bell et al. (2014). msb, Multisynaptic bouton. (D) m=mushroom spine, pf=perforated PSD, msb=multisynaptic bouton, mac=macular PSD, t=thin spine; *p < 0.05; ***p < 0.001.

