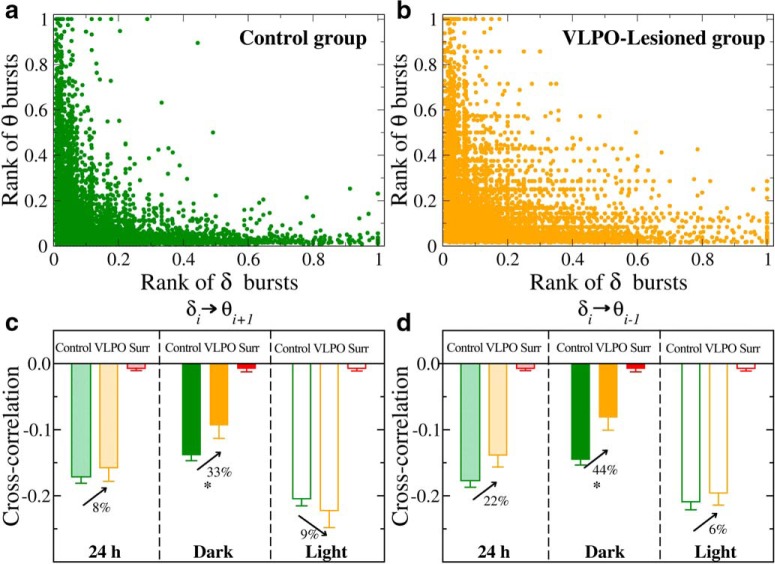
Figure 12.
Coupling between δ- and θ-burst durations indicates a common mechanism regulating the activity of these rhythms across the sleep–wake cycle. Scatter plots and rank correlation analysis demonstrate anti-correlated coupling between consecutive δ- and θ-burst durations. a, Scatter plot of δ burst ranks versus θ burst ranks in the dark period for control rats. Each dot represents a pair formed by a δ-burst and the following θ-burst, with burst durations separately ranked among the δ-bursts and the θ-bursts (longest duration corresponding to highest rank). b, Scatter plot of δ-burst ranks versus θ-burst ranks in the dark period for VLPO-lesioned rats. For each rat group, ranks are calculated separately for each rat and then plotted together. c, d, Average Spearman's cross-correlation coefficient for control and VLPO-lesioned rats in dark, light, and 24 h periods. Anti-correlations between consecutive θ- and δ-bursts are stronger during light than during dark periods in each group. Comparing dark versus light periods, the Student's t test gives p < 0.001 for control rats and p = 0.002 for VLPO-lesioned rats. Importantly, VLPO lesioned rats generally exhibit weaker anti-correlations than the control group, in particular during dark periods, where anti-correlation decreases with ≈35% compared with control rats [Control vs VLPO t test; (c) 24 h, p = 0.159; dark, p = 0.008; light, p = 0.700; (d) 24 h, p = 0.069; dark, p = 0.013; light, p = 0.273]. All correlation coefficients calculated in both groups are significantly different from the corresponding values obtained in the surrogates (red bars) after randomly reshuffling the original order of θ- and δ-bursts (t test, p < 0.001). All durations are calculated using a window w = 4 s and threshold Th = 1 on the ratio Rθδ (as in Fig. 1).

