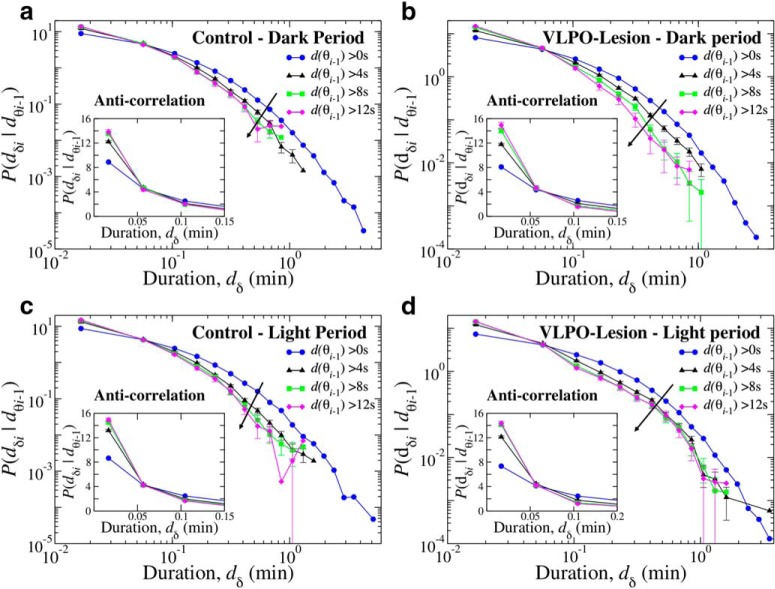
Figure 13.
Distributions of conditional probabilities for δ-burst durations show anti-correlated coupling between θ- and δ-bursts. a, Distribution of durations dδi given that the duration of the preceding θ-burst is larger than a given threshold d* for control rats in 12 h light periods. b, Distribution of durations dδi given that the duration of the preceding θ-burst is larger than a given threshold d* for VLPO-lesioned rats in 12 h light periods. c, Distribution of durations dδi given that the duration of the preceding δ-burst is larger than a threshold d* for control rats in 12 h dark period. d, Distribution of durations dδi given that the duration of the preceding δ burst is larger than a threshold d* for VLPO-lesioned rats in 12 h dark periods. Durations are calculated using a window w = 4 s and a threshold Th = 1 on the ratio Rθδ. Insets show details of conditional probability distribution for short dδi < 0.2 min. In all cases, the probability for longer dδi systematically drops for increasing d* values (faster declining tail of the conditional distribution), whereas the probability for shorter dδi significantly increases, as shown.

