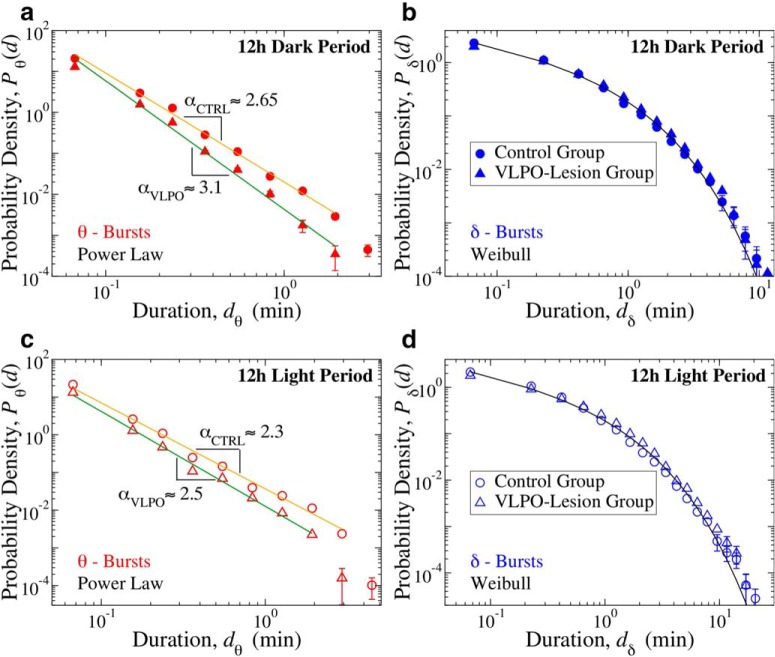
Figure 3.
Critical behavior represented by duality of power-law and Weibull distribution for θ- and δ-bursts characterizes cortical activity during both dark and light periods. a, Probability distributions of θ-burst durations for control (full circles) and VLPO-lesioned (full triangles) rats over the 12 h dark (lights-off) period (pooled data, 6 control and 6 VLPO-lesioned rats) follow a power-law with exponent αCTRL = 2.66 ± 0.07 and αVLPO = 3.13 ± 0.12 (exponent ± error on fit). Both groups exhibit an exponent larger than in the 24 h sleep–wake cycle (Fig. 2), in particular VLPO-lesioned rats, and the difference between the two groups becomes more pronounced (Control vs VLPO group comparison: t test, p = 0.003). b, Probability distributions of δ-burst durations for control (full circles) and VLPO-lesioned (full triangles) rats over 12 h dark (lights-off) period (pooled data) follow a Weibull behavior in both groups, with no significant differences in the fitting parameters (βCTRL = 0.66, λCTRL = 0.36; βVLPO = 0.72, λVLPO = 0.49). c, Probability distributions of θ-burst durations for control (open circles) and VLPO-lesioned (open triangles) rats over the 12 h lights-on period (pooled data, 6 control and 6 VLPO-lesioned rats) also follow a power-law, but exponents are smaller than in the dark period, with αCTRL = 2.28 ± 0.09 and αVLPO = 2.51 ± 0.07. The difference between the two groups is less pronounced than in dark period (Control vs VLPO comparison: t test, p = 0.131). Paired tests show significant differences between dark and light periods in each group: control dark versus control light t test, p < 0.0005; VLPO dark vs VLPO light t test, p = 0.0010. d, Probability distributions of δ burst durations for control (open circles) and VLPO lesioned (open triangles) rats over 12 h lights-on period (pooled data) also follow a Weibull behavior, with no significant differences in the fitting parameters (βCTRL = 0.70, λCTRL = 0.37; βVLPO = 0.67, λVLPO = 0.62). Black tick lines in c and d show Weibull fits for the distribution of the control group. All durations are calculated using a window size w = 4 s and threshold Th = 1 on the ratio Rθδ (Fig. 1). Error bars are calculated for each value and where not shown are smaller than the symbol size. Error bars δP are calculated for each value of the distributions as δP = ()/dD, and where not shown are smaller than the symbol size. Error bars calculation and binning procedure are described in Materials and Methods, Data analysis.

