
Figure 2.
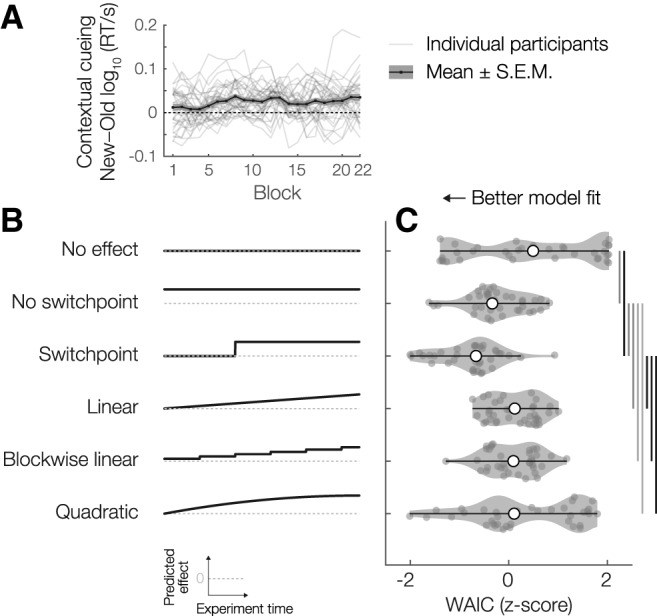
Reaction time modeling results. A, Contextual cueing effect over the time course of the experiment, both for the whole experimental sample and for the individual participants. B, Illustration of the six different models that were fit to the RT data for Old and New trials. Gray dashed line indicates 0 in each subpanel. Black solid line indicates the predicted evolution of the contextual cueing effect (RTNew − RTOld) over the course of the experiment. C, WAIC scores (z-scored across models per participant) for each of the models. Significance bars and violin plot details are as in Figure 1.