Figure 2.
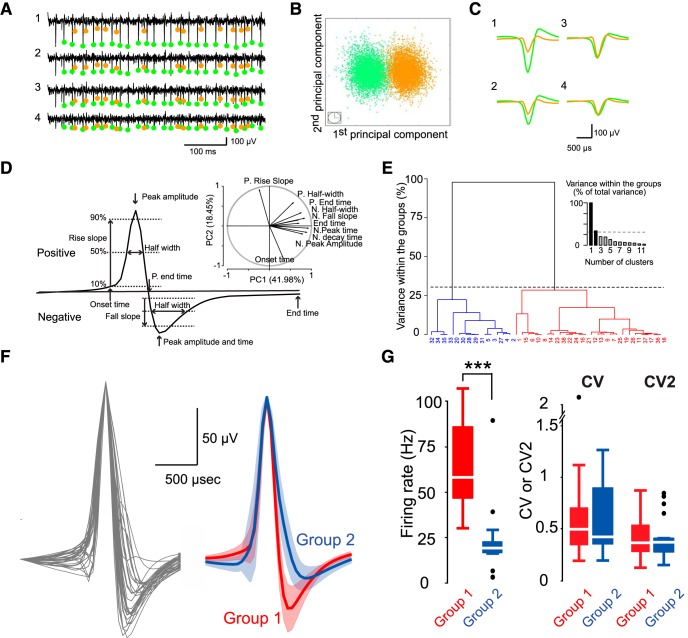
Tetrode recordings identify two distinct groups of CN neurons. A, Example of unit isolation: raw signal on the 4 recording sites of a single tetrode. Orange and blue dots represent spikes from the 2 units isolated by the PCA (Materials and Methods). B, Projection of the spikes from the 2 units against the first 2 principal components. C, Averaged spike waveforms of the 2 units on the 4 recording sites. D, Averaged waveforms for all the recorded units were classified using PCA followed by a hierarchical clustering on principal components (HCPC). Description of the measured parameters for the PCA and projection on the first two principal components (top right). Onset time, Time point where the spike waveform reached 5% of its positive peak; P. Rise slope, positive 10%–90% rise time; P. Half-width, spike duration at 50% of the positive peak; N. Peak amplitude, negative peak; Negative Peak time, time of negative peak; N. fall slope, 10%–90% fall time; N. Half-width, spike duration at 50% of the negative peak; N. Decay time, spike duration from negative peak to 10% of the negative peak; End time, time point at 5% of its negative peak. E, Ascending hierarchical tree highlighting 2 groups of action potential waveforms. F, Superimposed averaged spike waveforms of all units normalized to the maximum amplitude (left); mean of the averaged spike waveforms for the 2 groups (Group 1, red, n = 22; Group 2, blue, n = 17) (right) identified. Shaded area represents SD. G, Boxplot of firing rates, CV and CV2 for the 2 groups. Wilcoxon rank test, Firing rate: ***p = 1.4 × 10⁻⁷; CV: p = 0.37; CV2: p = 0.36.

