
Figure 1.
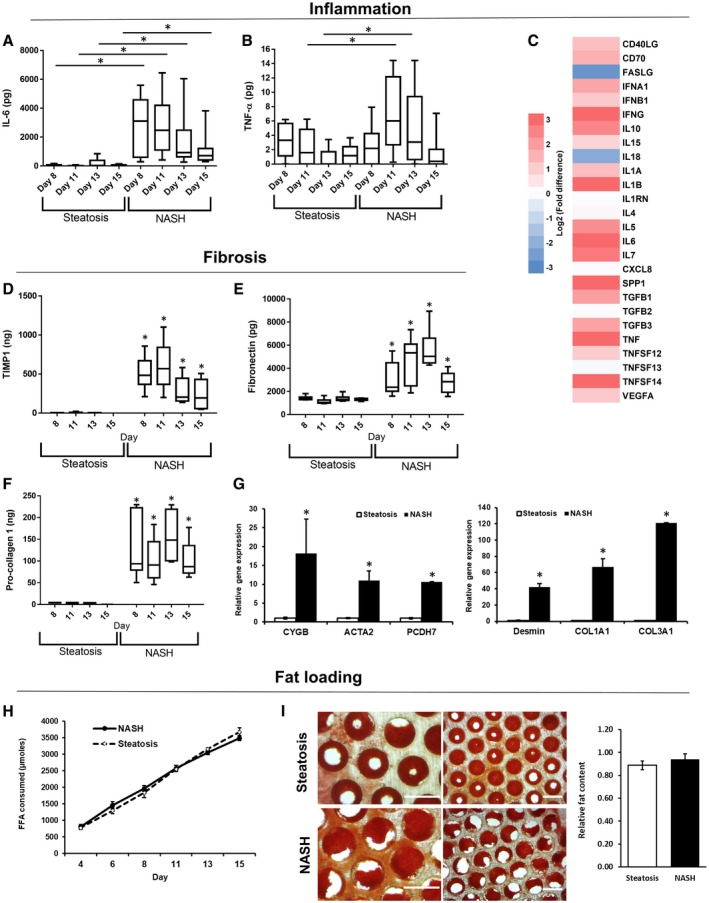
Phenotype of the in vitro human NASH model mimics key aspects of clinical disease. PHH alone (steatosis) or PHH, HK, and HSC co‐cultures (NASH) were cultured in the MPS for 15 days under high‐fat conditions (HEP‐FAT medium). Inflammatory responses were measured A) IL‐6 and B) TNF‐α production were measured by ELISA. (C) The expression of inflammatory/cytokine genes were analyzed in total RNA from both disease models using human cytokine RT2 profiler PCR arrays. Gene‐expression changes in the NASH model are expressed as a fold change over the steatosis model and are expressed as log2‐fold changes (red, up‐regulation; blue, down‐regulation). Fibrotic responses in the models were analyzed by determining the production of TIMP‐1 (D), fibronectin (E), and procollagen 1 (F) in cell culture medium, which were measured by ELISA. (G) Relative expression of profibrotic genes in total RNA, as measured by quantitative PCR; expression of each gene was normalized to glyceraldehyde 3‐phosphate dehydrogenase (GAPDH) and is shown as relative to steatosis samples. (H) Fat consumed by cultures over 15 days of culture was calculated by analyzing the culture medium for the presence of FFAs. (I) Fat loading in microtissues was confirmed using Oil Red O staining, which was quantified by absorbance at 510 nm; representative images also shown (scale bar = 400 µm). Data are expressed as means ± SD from a minimum of nine independent cultures (3 donors per condition and n = 3 per donor); *P < 0.05. Abbreviations: CD, clusters of differentiation; COL1A1, Collagen, type I, alpha 1; COL1A3, Collagen, type I, alpha 3; FASLG, Fas ligand; PCDH7, Protocadherin‐7; SPP1, Osteopontin; VEGFA, Vascular endothelial growth factor A.