Figure 1.
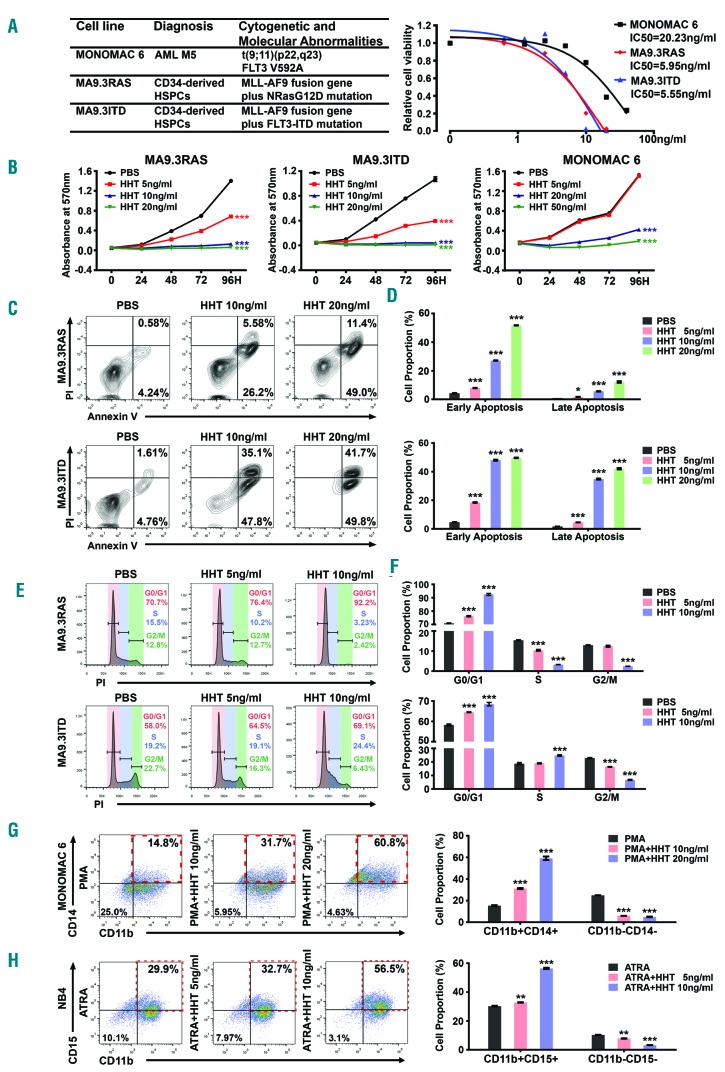
Acute myeloid leukemia (AML) cells display high sensitivity to homoharringtonine (HHT) treatment in vitro. (A) (Left) Genetic information of MA9.3RAS, MA9.3ITD and MONOMAC 6 and (right) the inhibitory concentration of 50% (IC50) values with HHT treatment at 48 hours (h) for these three AML cell lines. (B) Effects of HHT treatment on cell growth/proliferation in MA9.3RAS, MA9.3ITD and MONOMAC 6 at different time points (0, 24, 48, 72 and 96 h). The colors represent different HHT concentrations (0, 5, 10, 20 ng/mL; or, 0, 9.2, 18.3, 36.7 nM). (C) Effect of HHT on apoptosis in AML cells. All the cells were treated with HHT for 48 h and representative flow cytometric plots and percentages of cell apoptosis are shown. (D) Statistical apoptosis analysis from three independent experiments determined by flow cytometry. (E) Function of HHT on cell cycle arrest in AML cells. All the cells were treated with HHT for 48 h and representative flow cytometric percentages of cell cycle phases are shown. (F) Statistical analysis of cell cycle assays from three independent experiments determined by flow cytometry. (G) Staining of CD11b and CD14 in MONOMAC 6 cells upon HHT treatment for 96 h during PMA-induced monocytic differentiation (left panel), along with statistical analysis of cell proportions of CD11b+CD14+ and CD11b−CD14− in MONOMAC 6 (right panel). (H) Staining of CD11b and CD15 in NB4 cells [carrying t(15;17)/PML-RARA; AML-M3] upon treatment with HHT for 96 h during ATRA-induced granulocytic differentiation (left panel), along with statistical analysis of cell proportions of CD11b+CD15+ and CD11b−CD15− in NB4 (right panel). Red boxes in (G) and (H) represent the differentiated cell population with double positive markers. *P<0.05; **P<0.01; ***P<0.001; t-test. Error bar, mean±Standard Deviation.

