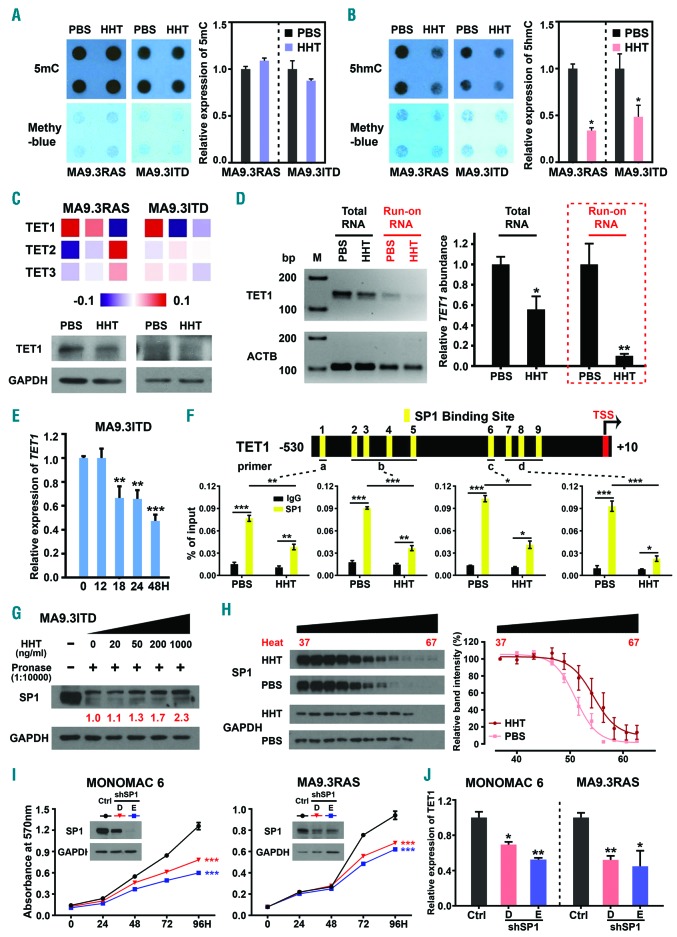
Figure 3.
Homoharringtonine (HHT) substantially reduces global 5hmC abundance via targeting SP1/TET1 in acute myeloid leukemia (AML). (A and B) Effects of HHT on global 5mC (A) and 5hmC (B) abundance in MA9.3RAS and MA9.3ITD AML cells upon treatment with 5 ng/mL HHT for 48 hours (h). (C) Relative expression of TET1 in HHT-treated MA9.3ITD at different time points, including 0, 12, 18, 24 and 48 h. (D) Heat map showing gene expression of the individual TET family members in MA9.3RAS and MA9.3ITD AML cells treated with phosphate-buffered saline (PBS) or HHT (5 or 10 ng/mL) for 48 h as detected by RNA-sequencing (RNA-seq) (top panel), along with western blotting result of TET1 in MA9.3RAS and MA9.3ITD AML cells treated with PBS or HHT (5 ng/mL) for 48 h (bottom panel). (E) RNA levels of TET1 and ACTB in Total RNA (in black) and Run-on RNA (in red) were determined by reverse transcription polymerase chain reaction (RT-PCR) (left panel, M, Marker). Qualitative PCR (qPCR) analysis of relative TET1 abundance in Total RNA and Run-on RNA isolated from PBS- or HHT-treated MA9.3ITD cells (right panel). (F) Schematic presentation of SP1 binding sites within the promoter region of TET1 (top panel). Chromatin immune-precipitation (ChIP)-qPCR assay was used to determine the binding of SP1 to the TET1 promoter in MA9.3ITD treated with PBS or 5 ng/mL HHT for 48 h. IgG was used as a negative control. (G) Identification of direct binding between HHT and SP1 via DARTS assay in MA9.3ITD cells. Western blot analysis of the DARTS samples. (H) Identification of direct binding between HHT and SP1 via CETSA assay in MA9.3ITD cells. Western blot analysis of the CETSA samples. (I) Western blotting analysis of SP1 knockdown efficacy and effects of SP1 knockdown on the growth/proliferation of MA9.3RAS and MONOMAC 6 AML cells. (J) Relative expression of TET1 in MA9.3RAS and MONOMAC 6 AML cells with or without SP1 knockdown. *P<0.05; **P<0.01; ***P<0.001; t-test. Error bar, mean±Standard Deviation.

