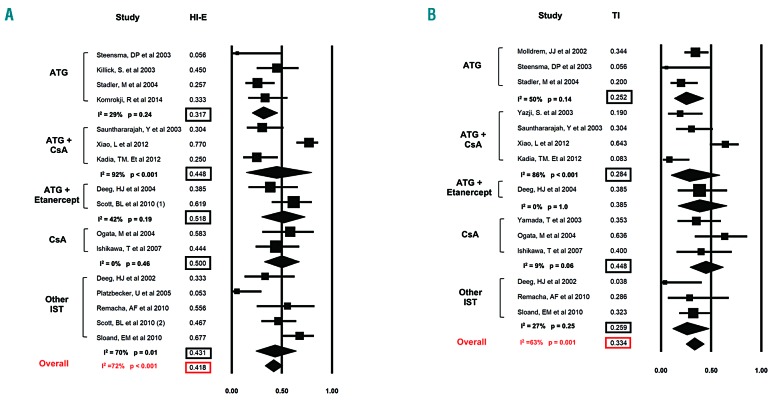
Figure 3.
Rate of hematologic improvement in the erythroid lineage (HI-E) and red blood cell transfusion independence. Forest plots of odds ratios (squares, proportional to study weights used in meta-analysis, 95% confidence intervals) for various forms of immunosuppressive therapy (IST), with the summary measure (center line of diamond) and associated confidence intervals (lateral tips of diamond) for hematologic improvement in the erythroid lineage (HI-E) and achievement of red blood cell transfusion independence (TI) are shown in panel (A) and (B), respectively.

