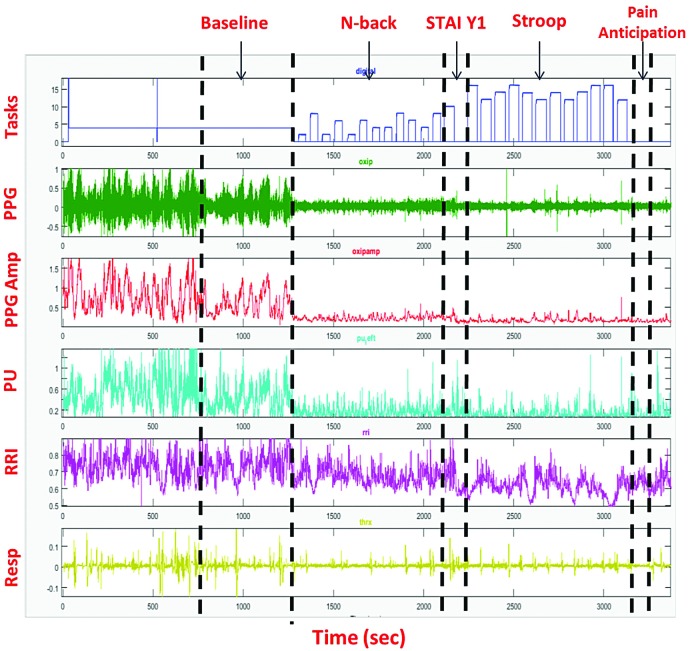
Figure 2.
Raw waveform and wave amplitude signal output from the Biopac System. Example of a recording from a single subject. The top panel (Tasks) is the output of the E-prime software where the height of the bars represents the difficulty of the task. The second and third panels are the photoplethysmography (PPG) signal and PPG amplitude (PPG Amp), respectively. The fourth panel is microvascu-lar perfusion (PU) determinecd by laser-Doppler. Panel five is the R-to-R interval from the electrocardiogram and panel six is the respiratory signal.

