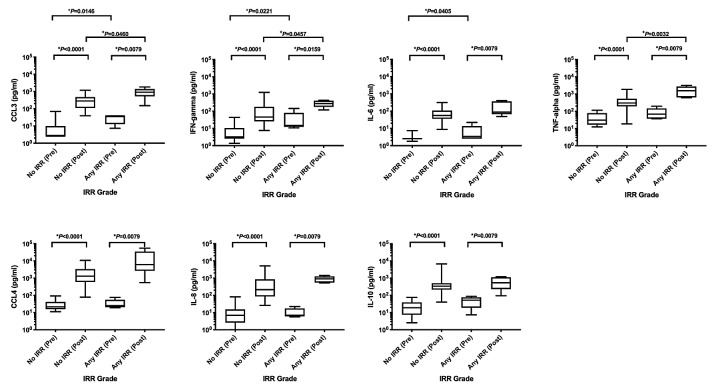
Figure 1.
Infusion-related reaction (IRR) to biomarker. Values compare the C1D1 pre-infusion sample against the highest of all the eight subsequent measures (C1D1 mid-infusion sample on 22 of 23 patients) and are sorted by the presence or absence of any IRR. Statistical analyses were performed accordingly using Mann-Whitney test. This figure includes only statistically significant values. °Statistical significance between pre-infusion levels. +Statistical significance between post-infusion levels. *Statistical significance between pre- and post-infusion levels in each group.

