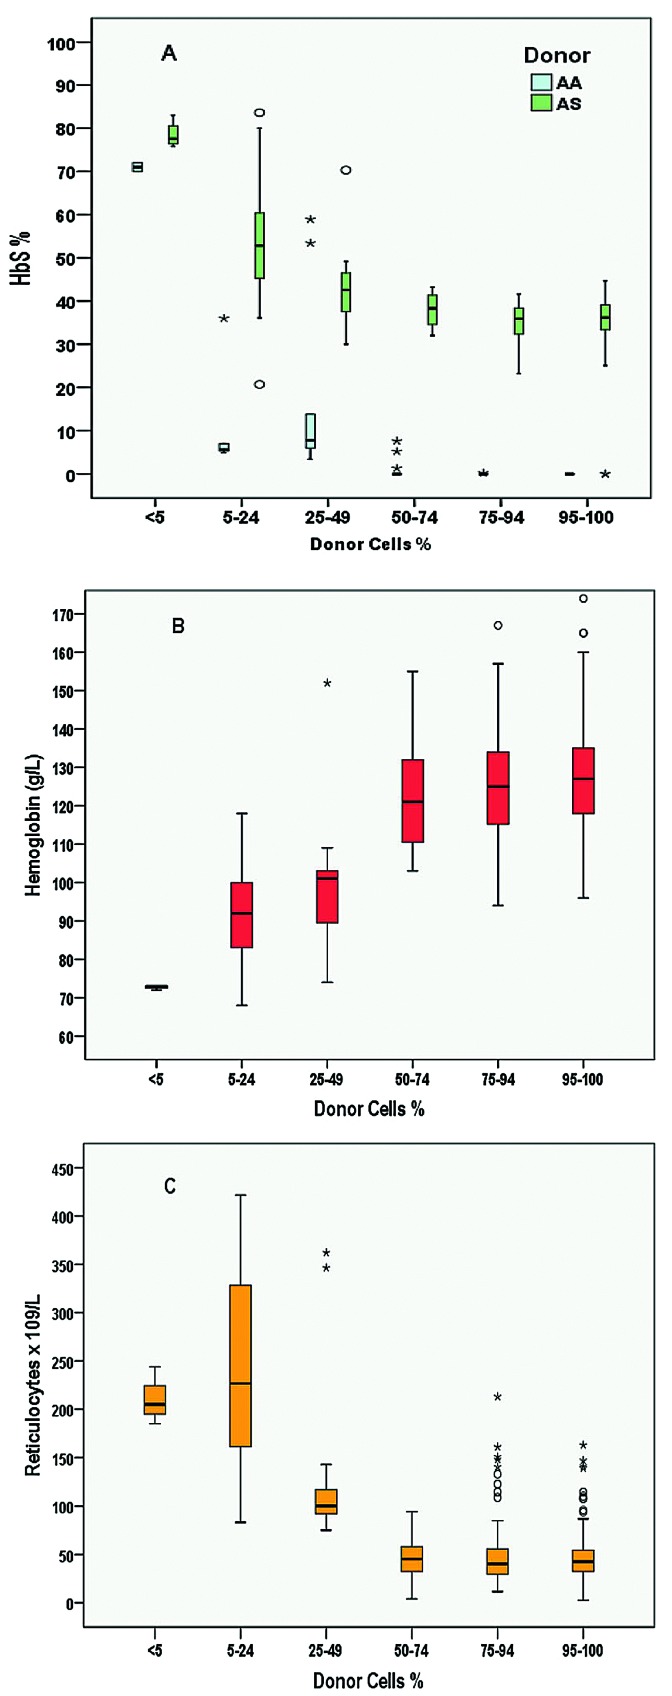
Figure 4.
Relationship between % donor cells and hemoglobin S percentage (HbS%), hemoglobin (Hb) level, and reticulocyte count. All biological data (HbS%, Hb and reticulocytes) recorded at the same time as the chimerism during the overall follow up were used for these box-plots. (A) Box-plot of HbS% according to the donor cell% category. This graph shows that HbS% is similar to that of the donor (AA or AS) as long as donor cell% is higher than 50%. (B) Box plot of Hb level according to donor cell% category. Hb level remains higher than 100g/L as long as donor cell% is higher than 50%. (C) Box plot of reticulocyte count according to % donor cells. Reticulocyte count remains lower than 100x109/L as long as % donor cells is higher than 50%.

