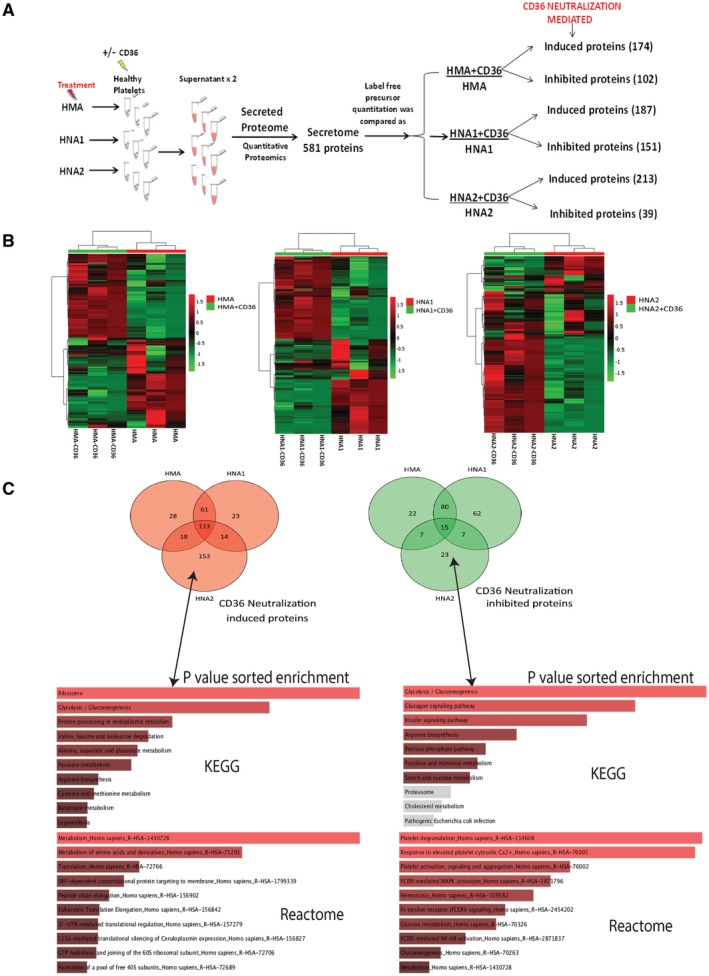
Figure 5.

Secretome analysis of platelets with CD36 blockade. (A) Experimental flow diagram of secretome analysis using high‐resolution mass spectrometry. (B) Heat map representation of secretome for HMA+CD36:HMA; HNA+CD36:HNA1; and HNA2+CD36:HNA2 represents distinct secretome in HNA2 group comparison. Red Venn represents proteins that are induced/increased, and green Venn represents proteins that get reduced/inhibited with CD36 neutralization (P < 0.05). (C) Pathway overrepresentation analysis (Kyoto Encyclopedia of Genes and Genomes/Reactome) of HNA2‐specific 153 protein‐induced and 23 HNA2‐specific proteins inhibited under CD36 neutralization (P < 0.05, C‐score > 1).
