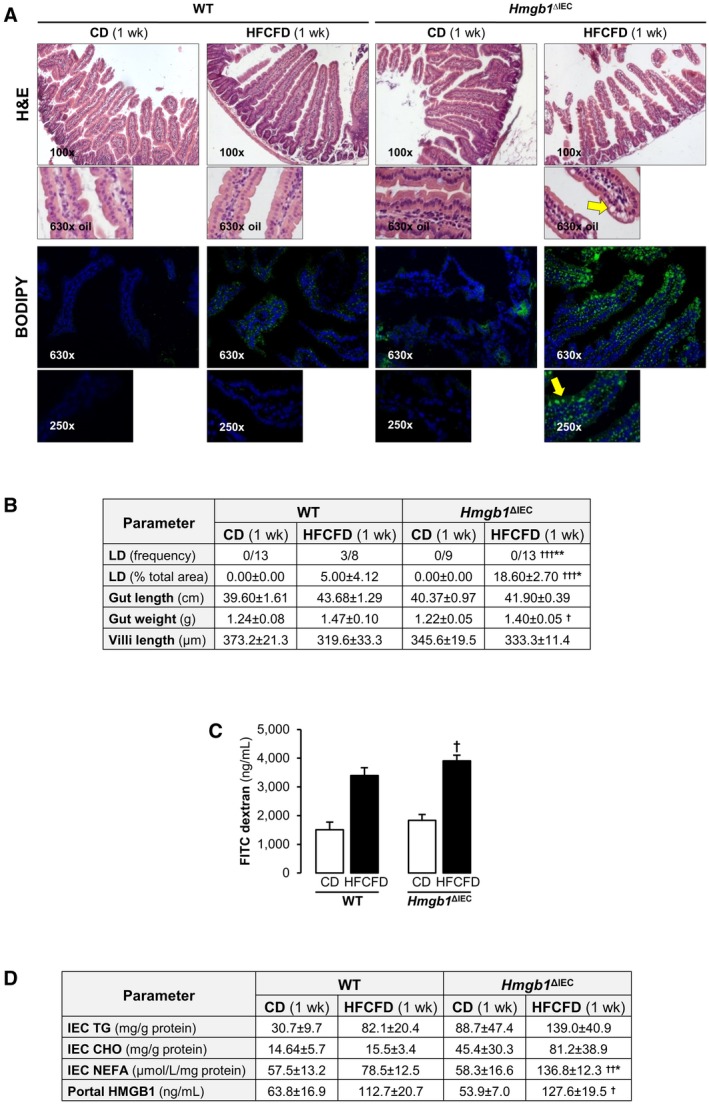
Figure 2.

Hmgb1 ΔIEC mice display HFCFD‐induced atypical LD accumulation in the jejunum after 1 week. WT and Hmgb1 ΔIEC mice were fed the CD or HFCFD for 1 week. (A) H&E staining (top) and BODIPY FA staining (bottom) of the jejunum (yellow arrows: LD). (B) Pathology scores. (C) FITC‐Dextran concentration in portal serum indicative of gut permeability. (D) IEC TG, CHO, and NEFA and HMGB1 levels in portal serum. Data are expressed as mean ± SEM except for LD frequency, which is shown as the number of cases per group (n ≥ 8 mice/group). † P < 0.05, †† P < 0.01, and ††† P < 0.001 for HFCFD versus CD; *P < 0.05 and **P < 0.01 for Hmgb1 ΔIEC versus WT mice.
