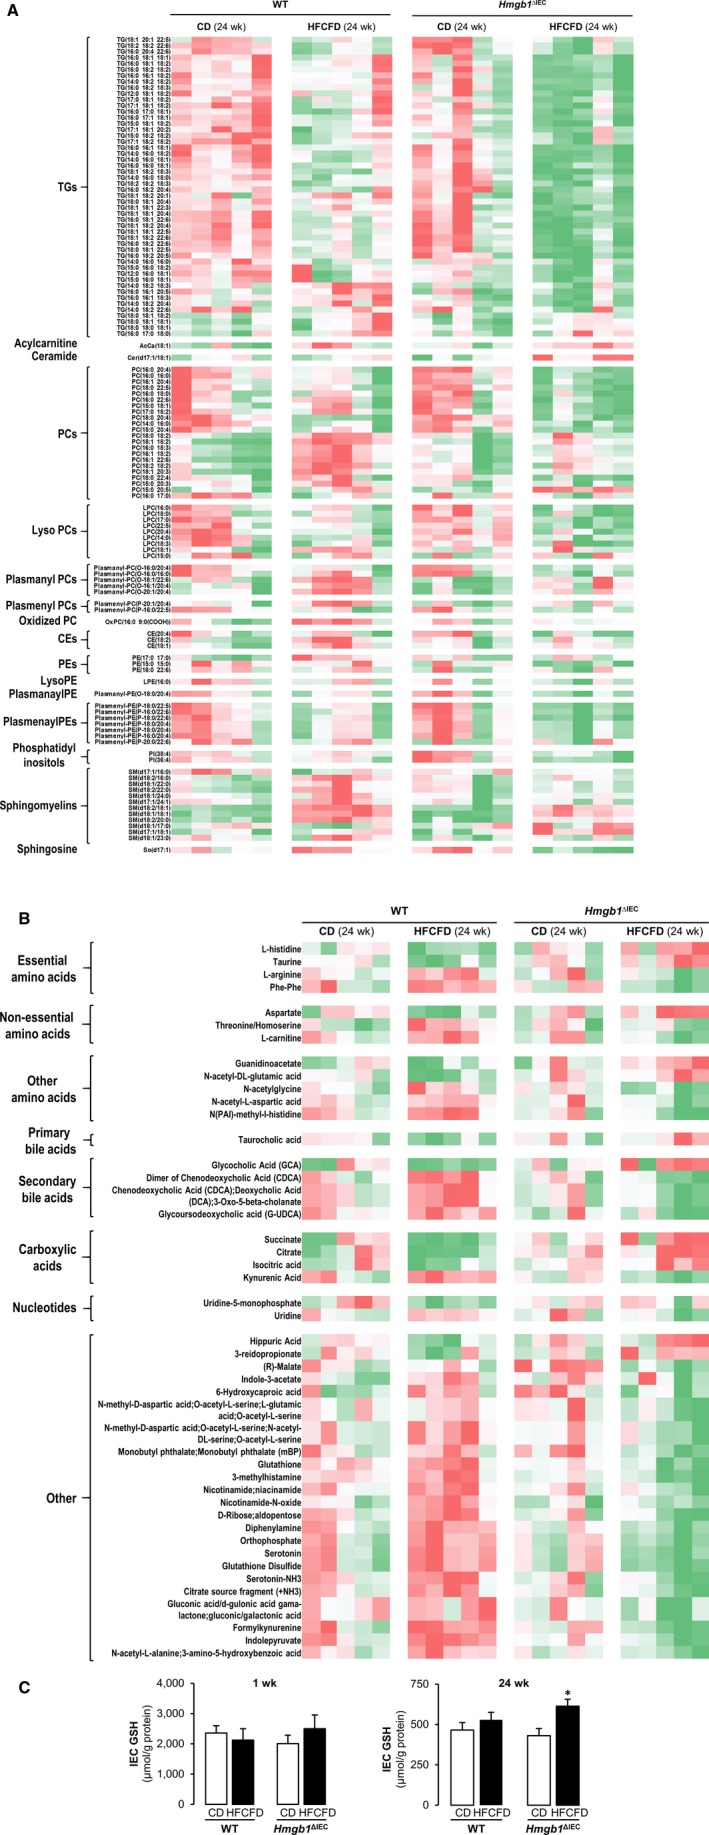
Figure 4.

Hmgb1 ΔIEC mice fed the HFCFD display altered lipid and metabolic profiles in portal serum after 24 weeks. WT and Hmgb1 ΔIEC mice were fed the CD or HFCFD for 24 weeks. Portal serum was collected following sacrifice, and untargeted lipidomics and metabolomics analysis were performed. Peak intensities were normalized to internal standards and subject to generalized linear model analysis; species with significant (P < 0.05) differences in peak intensity between genotype or diet are plotted in a heatmap with hierarchical clustering; intermediates are separated by lipid classes or molecule type. Lipidomics data are plotted in (A) and metabolomics in (B) (green: low; red: high). (C) GSH levels in IEC at 1 week and 24 weeks of feeding the CD or HFCFD. Data are expressed as means ± SEM (n ≥ 5 mice/group). *P < 0.05 for Hmgb1 ΔIEC versus WT mice.
