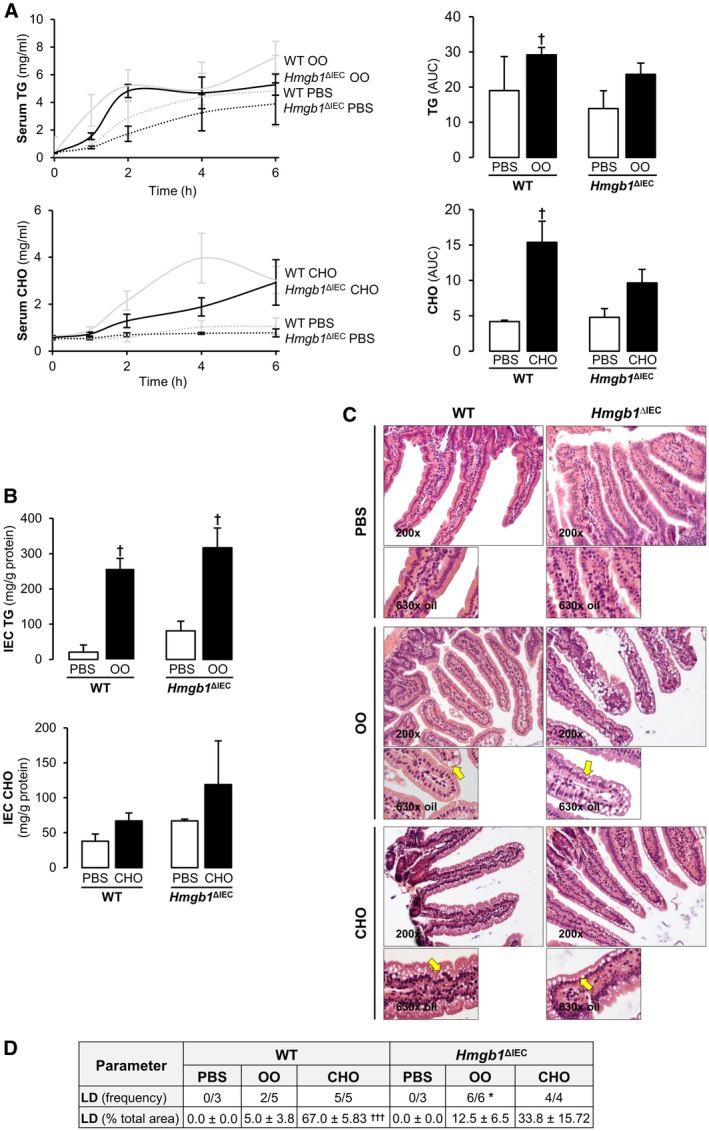
Figure 5.

Hmgb1 ΔIEC mice have delayed and/or reduced CM release. WT and Hmgb1 ΔIEC mice were fasted overnight and serum was drawn to record baseline levels of TG and CHO. Then, mice were injected intraperitoneally with 300 mg/mL of Tyloxapol, and 5 minutes later they were gavaged with 200 µL of OO, 2% CHO, or PBS alone. Serum samples were drawn at 1, 2, 4, and 6 hours after gavage. Mice were sacrificed at 6 hours, tissues harvested, and IEC isolated for histological and biochemical analyses. (A) Time‐course analysis and matching AUC of serum TG and CHO. (B) IEC TG and CHO concentration. (C) H&E staining of the jejunum (yellow arrows: steatosis). (D) LD frequency and percentage of total area. Data are expressed as means ± SEM except for LD frequency, which is shown as the number of cases per group (n ≥ 3 mice/group). † P < 0.05 and ††† P < 0.001 for OO or CHO versus PBS; *P < 0.05 for Hmgb1 ΔIEC versus WT mice.
