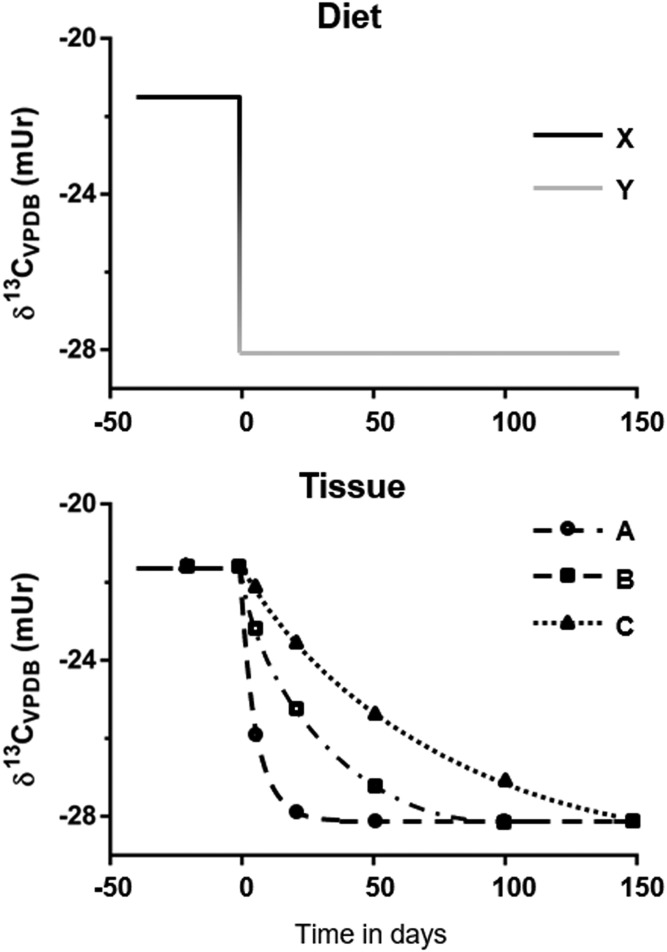
Fig. 1.
Graphical representation of a dietary switch experiment. The top panel is an example of the isotopic dietary parameters of a dietary switch experiment. Animals are equilibrated to study diet X with an isotope ratio of −21.5 mUr and then switched to diet Y with an isotope ratio of −28 mUr at time 0. The bottom panel depicts the resulting changes in tissue carbon isotope ratios in response to the dietary switch. As the compound of interest is metabolized it is replaced with that from the diet, which has a different δ13C value. By measuring and plotting changes in tissue δ13C signatures over time, tissue-specific turnover can be modeled.

