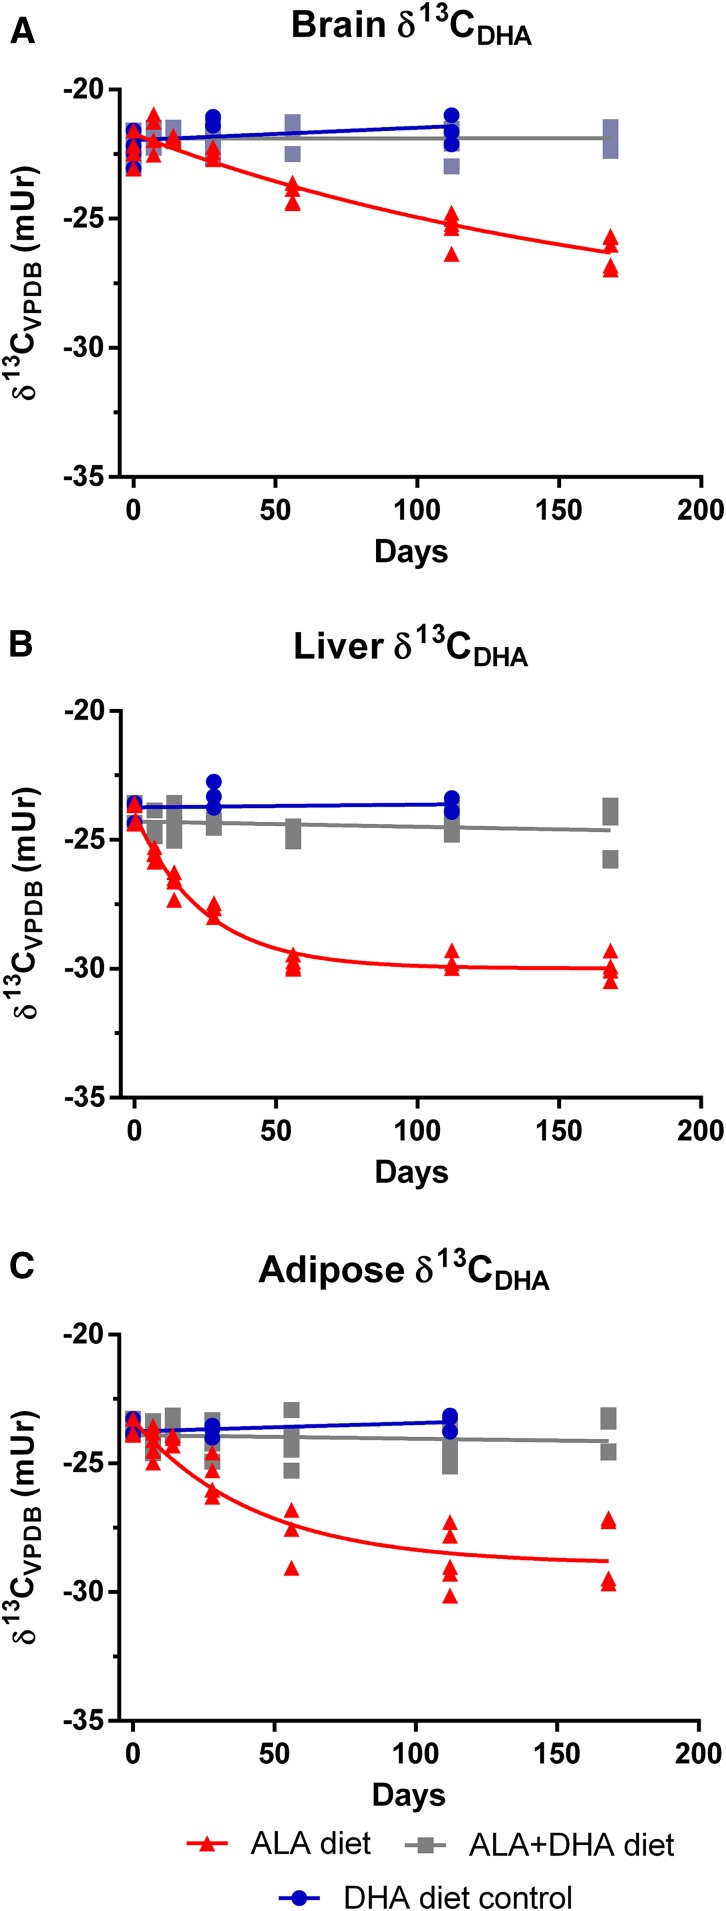
Fig. 6.
Change in brain (A), liver (B), and adipose (C) δ13CDHA signatures following the dietary switch from mice equilibrated to the DHA diet. Changes in carbon isotope ratios for the ALA diet group were fit with a one-phase decay function on untransformed data (n = 3–5 per time point). Carbon isotope ratios from the ALA + DHA group were not adequately modeled by a one-phase decay function and were instead fit by linear regression; slopes from linear regression analyses from all tissues did not deviate from zero (P > 0.05). ALA, α-linolenic acid; VPDB, Vienna Peedee Belemnite.

