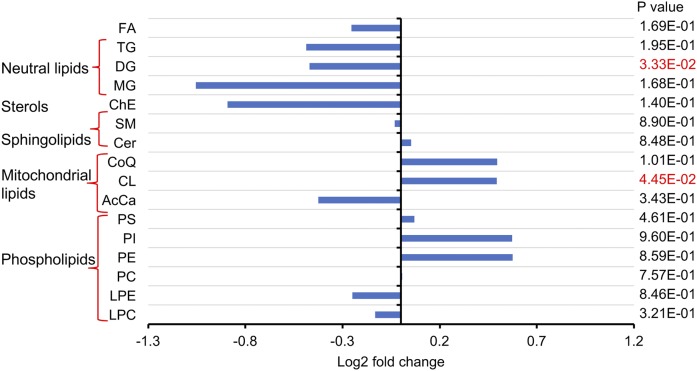
Fig. 4.
Changes in the liver lipidome of Ldlr−/− mice after 12 weeks of feeding inulin- or cellulose-supplemented (control) atherogenic diet (n = 9–10 per group). Lipidomic analysis was performed using UHPLC-Q Exactive MS. Comparisons of total lipid levels between groups were made by unpaired Student’s t-test considering significance at the level of P < 0.05. CoQ, coenzyme Q; AcCa, acylcarnitine.

